Weighted least-squares regression
Download: WeightedLeastSquares1_init.xlsx
Introduction
Ordinary least-squares (OLS) regression assumes that the variables contain all of the uncertainty (ie, the values are known exactly) and that all of the measurements have exactly the same precision. For that scenario it can be shown that the least-squares estimates, which are the esimtates that minimize the sum of the squared residuals, , are the BLUE statistics: the Best Linear Unbiased Estimates, where “best” means the statistics that are the “most efficient.” There are other advantages to LS estimates, as has been discussed elsewhere.
But what of the measurements are not equally precision? One option is to transform the (and possibly also the ) values in order to stabilize the variance. But in most situations a better approach is to actually estimate the precision of each measurement and incorporate that into the regression model. The most common way of doing that is to use weighted least-squares (WLS) regression in which the regression parameters are estimated so that they minize the sum of the weighted residuals:
In ordinary LS regression each residual exerts an equal “pull” on the fit: no residual is more important than any other, and the fitting procedure tries equally hard to minimize each of the residuals. But in weighted LS regression, the measurements that are known more precisely carry a greater weight: they are more important than the less precise measurements.
It can be shown that parameter estimates that minimize are the BLUE statistics. But the OLS estimates are still unbiased even with heteroscedastic data; as we will see in this screencast, the importance of WLS is not just that it gives the best estimates but that the estimate of the standard error of those statistics is much more accurate than with OLS. One caution, however: if the measurement precisions are not well characterized, then performing WLS can actually lead to greater standard error due to the extra noise introduced by the standard deviations.
Learning Goals
- Understand the difference between ordinary and weighted LS regression
- Learn to perform WLS regression using the VBA nonlinear regression procedure
Tasks
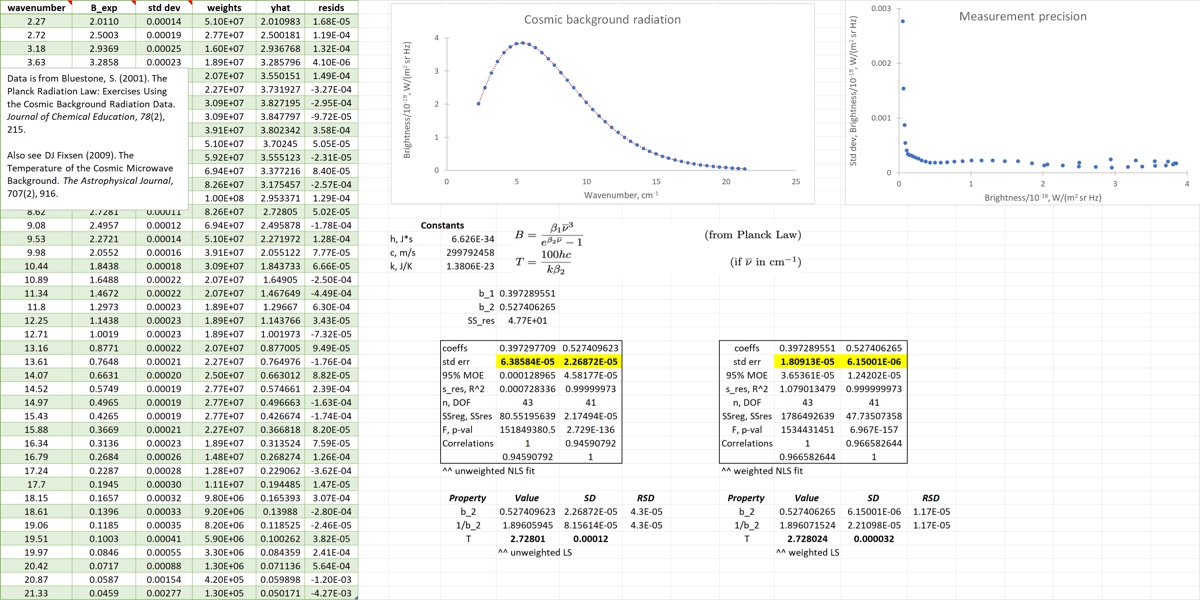
- Perform unweighted NLS regression to fit the data to Planck’s Law (ignoring the standard deviation column) and then estimate the temperature of the blackbody as well as its standard error
- Examine the nature of the measurement precision and calculate the weights
- Set up the weighted
SS_rescell and perform weighted NLS regression to fit the data. Compare the results to the unweighted results. - Calculate the predicted temperature and its standard error using the weighted NLS fit, and compare to the previous result.
When you finish your spreadsheet should look something like the image below.