Two-sample bootstrap comparisons
Download: BootstrapComparisons_init.xlsx
Introduction
To compare the properties of two samples we typically use a comparison statistic of some kind. If we are comparing measures of location the comparison statistic is formed by the difference of the location statistics of the two samples. If we are comparing measures of dispersion (ie, scale) we would use the ratio of the two sample statistics.
If we want to test if the two statistics are significantly different we will want to form a confidence interval of our comparison stat. When comparing location stats, we check if the CI contains 0; when comparing scale stats we check if it contains 1.
So far we have looked at parametric methods of creating these confidence intervals. In this screencast we will learn to use bootstrapping to create nonparametric CIs for comparison statistics, exploring the additional possibilities that this ability opens to us.
Learning Goals
- A better understanding of the nature of two-sample comparison tests
- A review of named Excel functions and of performing an F-test
- Understanding how to bootstrap a comparison statistic for independent samples
- Bootstrapping comparison statistics using
BootCompareandBootCompareCIand applying them to comparisons of location and scale
Tasks
- create named formulas for male (
sulfate_male) and female (sulfate_female) measurement errors - review: do an F-test to compare the between-student sulfate measurement error variability by gender
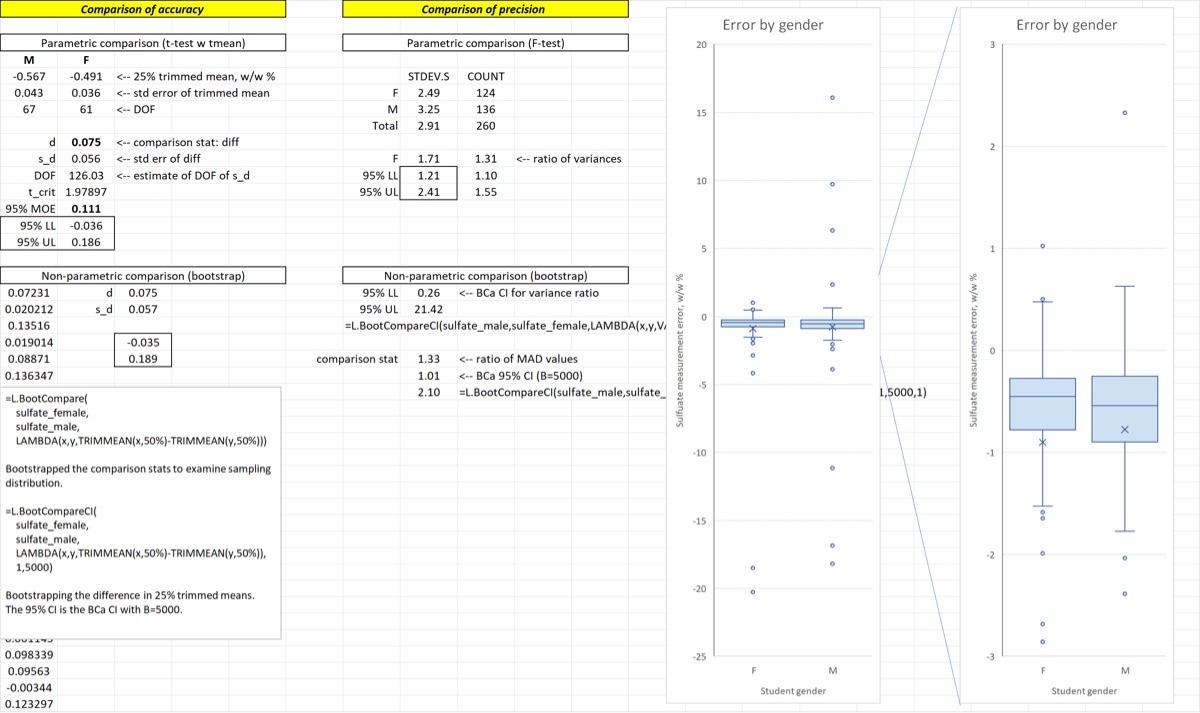
- do bootstrap versions of the t-test (comparison of 25% trimmed means) and F-test
- bootstrap the ratio of MAD values by gender as a robust comparison of error variability
By the end of the screencast your worksheet should resemble the image below.