Standardization
Download: Standardization_init.xlsx
Introduction
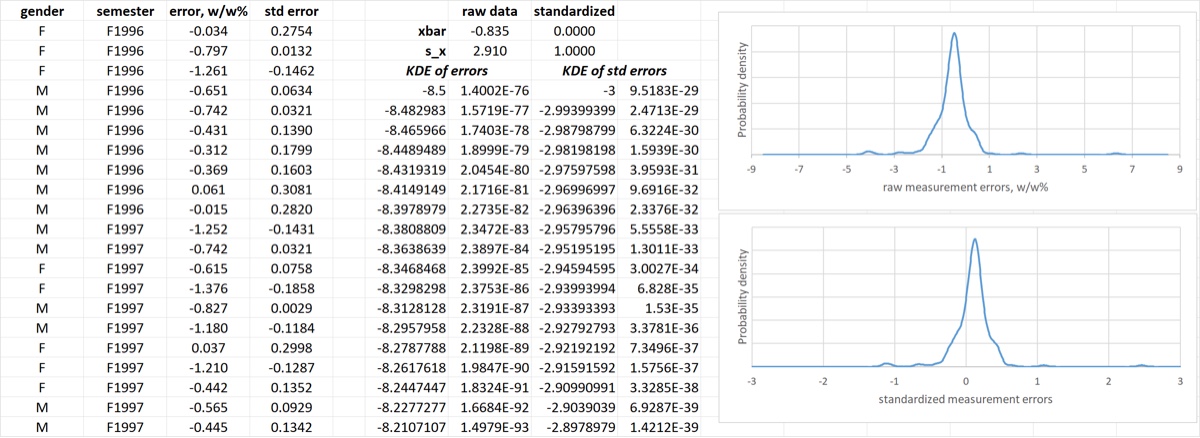
One common data transformation operation in statistics is standardization, which is a combination of centering the data on a mean of zero and scaling the data to unit standard deviations. (Variations on this exist using robust measures of location and scale.) Basically what this does is change the units of the values from the original units to units of standard deviations from the mean. This can be useful for outlier detection.
Learning Goals
- learn how to standardize the data and interpret the results
Tasks
- name the measurement errors range
- import the
Densitylambda function.- Note that the spreadsheet above does NOT have the CLS-Stats lambda functions installed.
- Usually I install them for you and the add-in itself by default copies them to new workbooks, but I think this is a useful reminder that that isn’t always the case.
- create a row of standardized data
- compare the means and standard deviations of the raw and standardized data
- create KDE plots to compare the shapes of the two data sets as well as the X axes of the plots.
When you are finished your spreadsheet should look like the image below.