Simulations
Download: G6-Simulations_init.xlsx
Introduction
Many statistical studies use random number generators (RNGs) to simulate the behavior of random variables. These RNGs can be used to emulate the behavior of populations that follow specific probability distributions, such as normal and lognormal distributions. Both Excel and CLS-Stats have RNGs that can be used to perform simulations. This screencast is an introduction to these RNGs.
Learning Goals
- Understand how random number generators work and what RNGs are available in Excel and in the CLS-Stats library
- Understand what a volatile function is in Excel and how to manage them
- Learn to simulate random variables that follow specific distributions in Excel
- Learn how to generate reproducible and nonvolatile random numbers using the CLS-Stats library
- Learn how to use the
rerrorandrerrorVCLS-Stats functions to simulate random variables with specific skew and kurtosis
Tasks
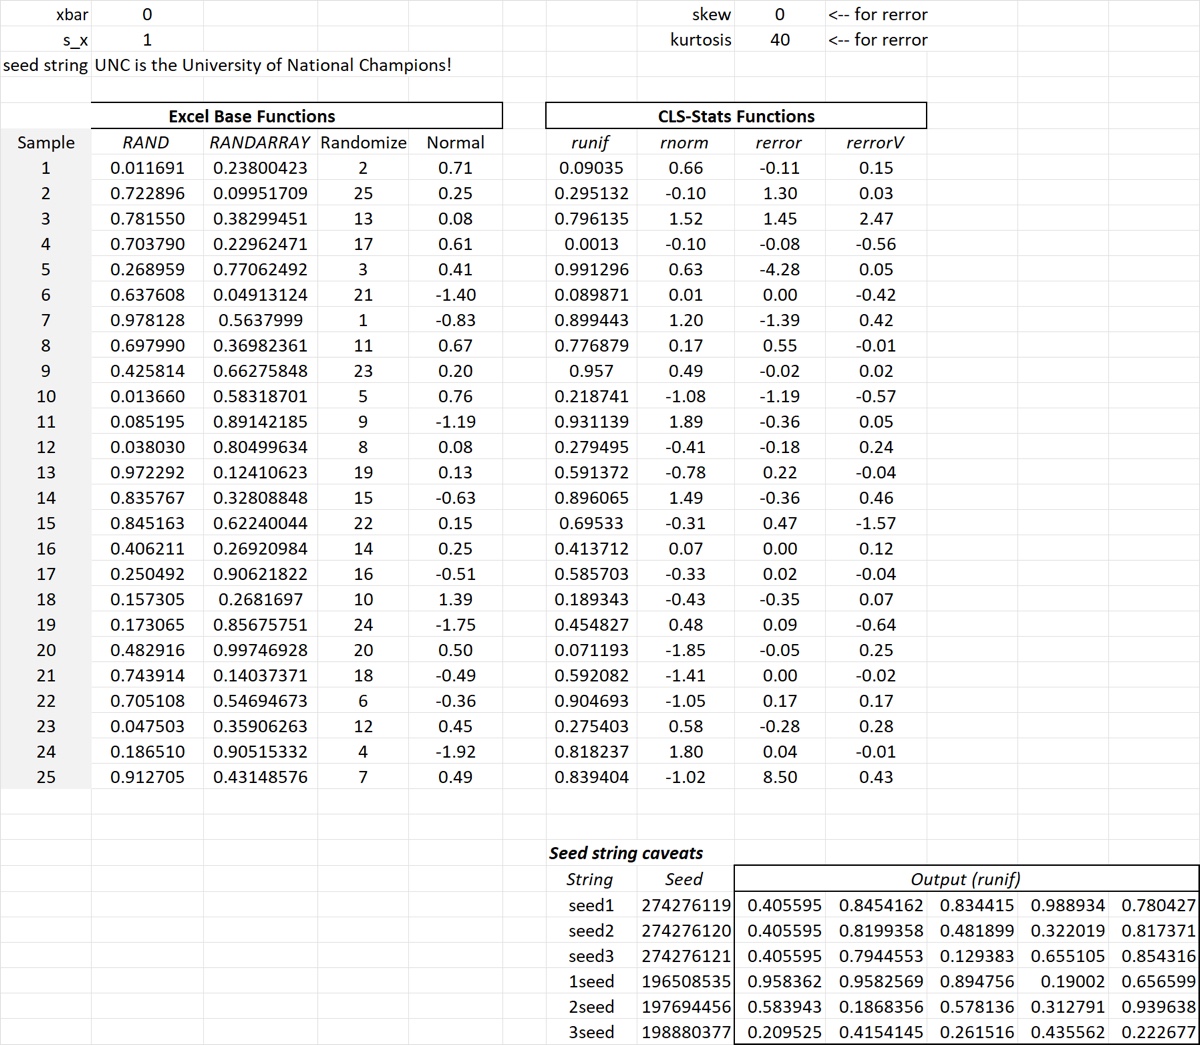
- Generate 25 random numbers with
RANDandRANDARRAY(and pledge to always useRANDARRAYoverRANDin the future) - Randomize a list using
RANDARRAYandrunif - Draw 25 random samples from a normal distribution using
RANDARRAY - Control volatile functions by turning automatic calculations on and off
- Use CLS-Stats functions
runifandrnormand control the volatility and reproducibility of the result - Use
rerrorto simulate a random variable with specific skew and excess kurtosis - Compare the behavior (and use cases) of
rerrorandrerrorV - Note some caveats for seed strings
Once you are finished with the screencast your spreadsheet should look like the image below.