Regression uncertainty bands
Download: RegressionBands_init.xlsx
Download: Slides.pdf
Introduction
Up until now the regression screencasts have been mostly concerned with the prediction of the regression parameters: how to make those predictions using least-squares regression, and the statistical properties of those predictions or the related task of statistical inference on the basis of the parameter estimates. Now we turn our attention to two other types of prediction:
- prediction about the dependent variable for a given value of independent variable
- prediction about the independent variable for an observed value of dependent variable
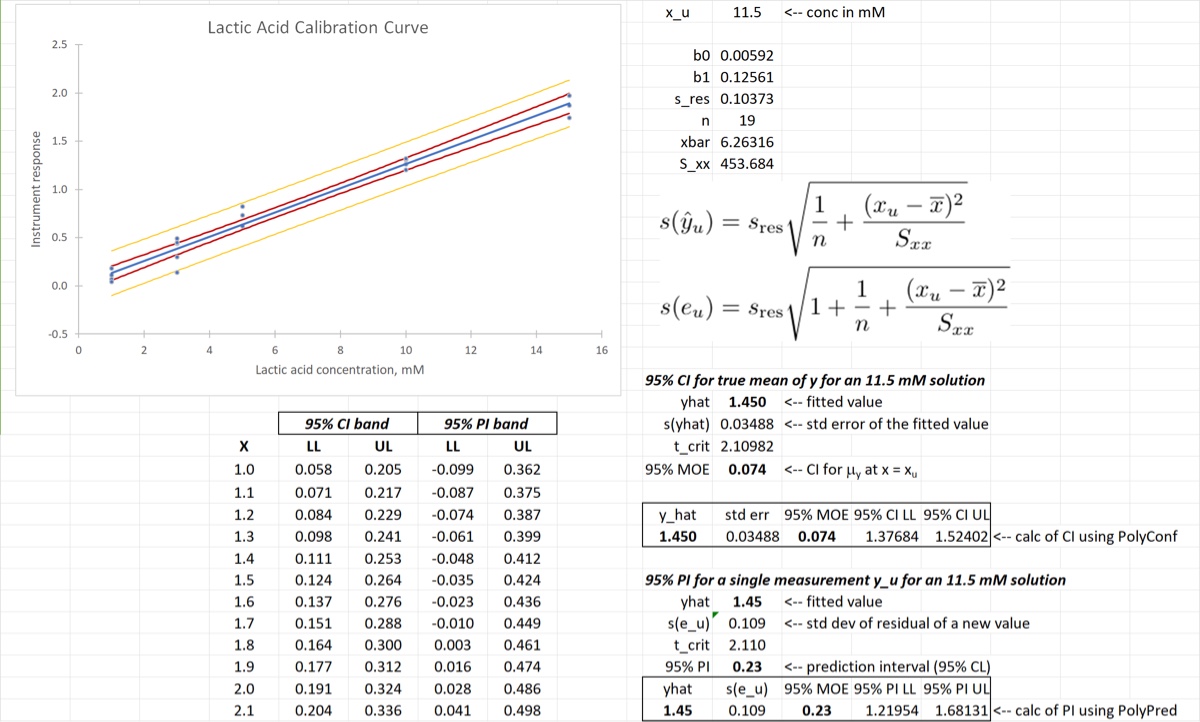
The first type of prediction is the most common, and comes in two forms; these two types of predictions – which result in confidence bands and prediction bands around the regression fit – are the topic of this screencast.
Learning Goals
- Understand the nature and uses of confidence bands and prediction bands in regression analysis
- Learn how to calculate confidence intervals (or bands) and prediction intervals (or bands) in Excel
Tasks
- Manually calculate a 95% confidence interval for at 11.5 mM lactic acid
- Use the
PolyConffunction to calculate the same CI - Calculate the confidence band and add it to the plot
- Manually calculate a 95% prediction interval for at 11.5 mM lactic acid
- Use
PolyPredto calculate the same PI - Calculate the prediction band and add it to the plot
When you are finished with the screencast your spreadsheet should look something like the image below. The wider band around the calibration curve is the prediction band.