Regression in Excel
Download: RegressionInExcel_init.xlsx
Introduction
Regression analysis is possibly the most common method of statistical analysis. In this screencast we will demonstrate four ways of doing regression in Excel. In all cases we will fit a straight line to some measurement data, sometimes called a simple linear regression (SLR) model:
In regression analysis all uncertainty is assumed to be contained in the variable and the (intercept) and (slope) terms are unknown population parameters called regression parameters. The techniques presented in this screencast all return least-squares estimates of these parameters. We will explore the statistical properties of these parameters in future screencasts.
Learning Goals
- Learn some important (native) ways of doing regression in Excel
- Explore three selected CLS-Stats lambda functions related to regression
Tasks
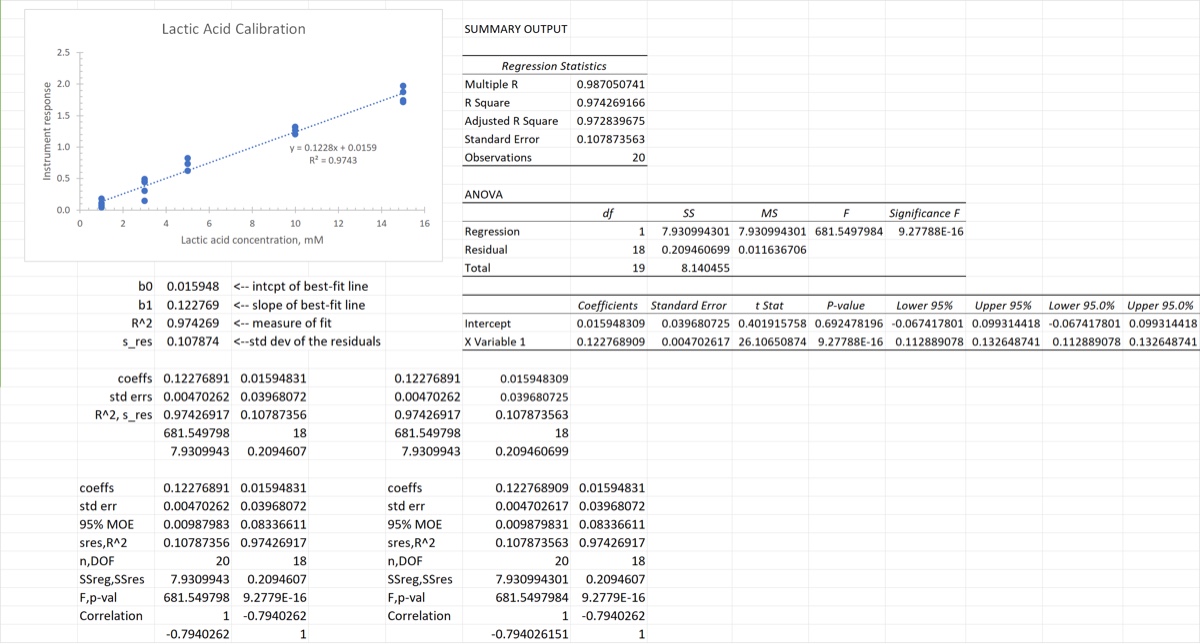
- Plot the data and then add a trendline and display the equation
- Use four simple functions to return SLR least-squares statistics:
INTERCEPT,SLOPE,RSQ, andSTEYX - Use the Analysis ToolPak regression procedure
- Use
LINESTand label its output. - Use three CLS-Stats regression functions:
LINEST: the CLS-Stats version, a drop-in replacement for Excel’s function that allows for blank valuesOLS: Performs ordinary least-squares regression, returning more statistics thanLINESTand labeling the outputPolyLS: A convenient wrapper forOLSfor polynomial least-squares regression
When finished your spreadsheet should look something like the image below.