Regression and ANOVA
Download: RegressionPartitioning_init.xlsx
Introduction
Many statistical packages produce an “ANOVA table” as part of the output for regression analysis; Excel’s own Analysis ToolPak does this. In this screencast we explore the meaning of this output and the connection between regression and ANOVA.
Regression analysis and ANOVA are closely related: both partition the variability of measurements. The syntax of the basic functions in CLS-Stats is even similar: ANOVA(Y,X) and OLS(Y,X), where is the response variable (the measurements) and is the independent or “explanatory” variable. In both cases the goal is to explain (numerically) the portion of the variability in that is due to changes in . The big differences:
- in ANOVA the explanatory variable is a categorical variable: a label on the grouping of measurements.
- in regression the explanatory variable is a numerical variable and may include a more sophisticated functional relationship between the two types of variables, with regression parameters that have physical meaning. (For example, with an Arrhenius plot the regression parameters can be used to estimate the reaction activation energy.)
The mathematics of ANOVA and regression are similar; in fact ANOVA can be considered a subset of regression. The fundamental partitioning between the sources of variability for the two can be expressed in terms of sums of squared deviations:
In this screencast we will compare how the two methods partition variability for a dataset in which there are replicate measurements at each value. We will also show that the coefficient of determination, , is the fraction of variability that is explained by the regression model:
Note that a similar statistic, , exists in ANOVA but is less commonly used.
Learning Goals
- Be able to explain and demonstrate how ANOVA and regression partition the variability of the response variable,
- Be able to explain the nature of the coefficient of determination, , and related terms (SS terms and their DOFs, F-value, etc) in the output of
OLSand other regression routines
Tasks
- Review the ANOVA table output and the
OLSoutput in the regression output of the Analysis ToolPak for the data set. - Perform ANOVA of the data set, grouping by lactic acid
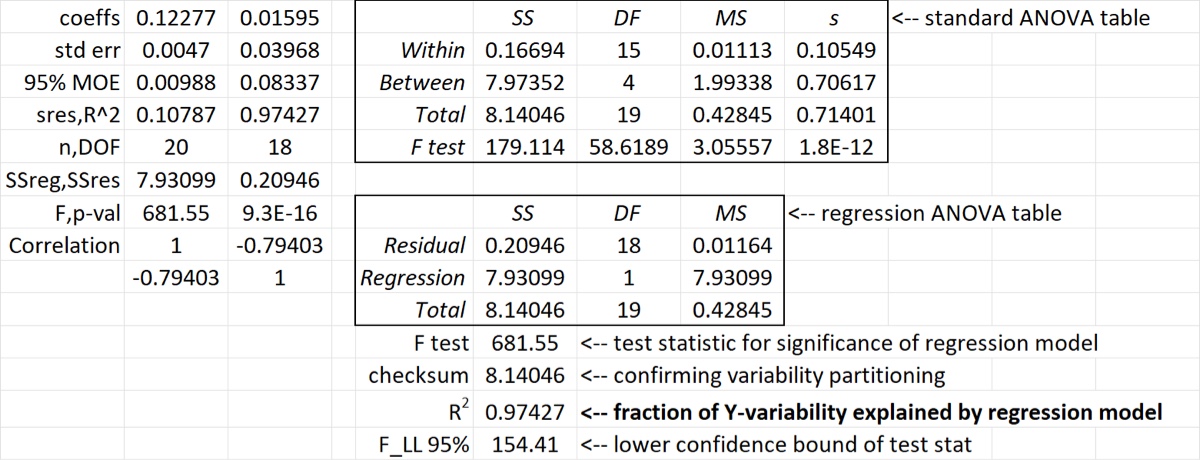
- Manually calculate the regression ANOVA table (SS, DF, and MS terms for regression and for residuals)
- Perform the F-test for regression
When you finish, the relevant portion of your spreadsheet should look like the image below.