QQ plots
Download: G5-QQplots_init.xlsx
Introduction
Quantile-quantile (QQ) plots are used to compare the shapes of distributions. In this screencast you will learn how to create a QQ-plot of a sample against a standard normal distribution.
Learning Goals
- Learn how QQ plots are constructed
- Learn how to interpret the QQ plot of a data set against the standard normal distribution
Tasks
- Use the CLS-Stats function
QQnormto generate a QQ plot of the sulfate measurement errors against the standard normal distribution - Create a duplicate of the plot and zoom in so that the gross outliers are not shown
- Add a reference line to the plot with
QQrefand interpret the result. - Calculate the QQ plot manually
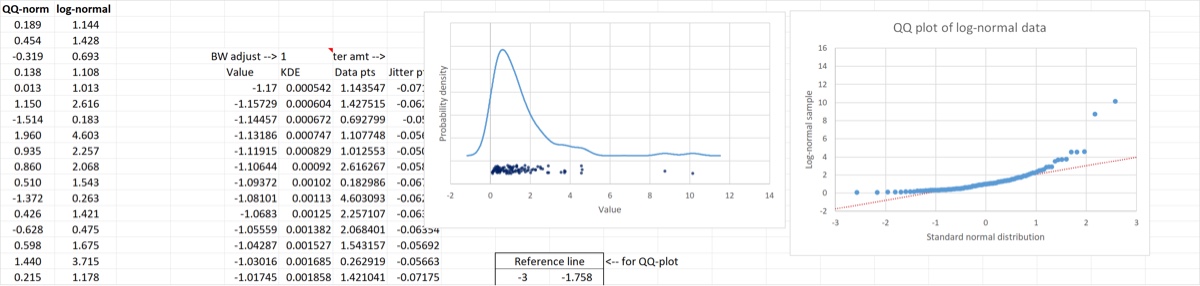
- Create a QQ plot (with reference line) of log-normal data and interpret the result. Compare to the QQ plot of the sulfate measurement data.
When you are done the first workbook sheet should look like the image below.
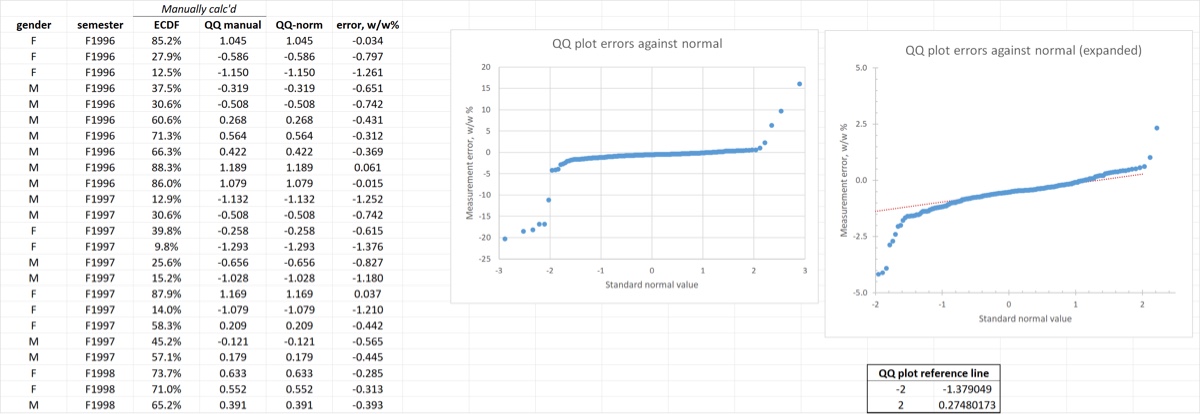
The second sheet should look like the following image.