Propagation of error 2
Download: V2-ErrorPropagation2_init.xlsx
Introduction
When we apply the propagation of error partial derivatives method to curved transformations, we are making the assumption that a linear approximation of the function is valid on the scale of the uncertainty. The Monte Carlo (MC) method of error propagation is an alternative method that does not make this assumption, and has a few other added benefits. It is based on simulations and will be illustrated in this screencast.
Learning Goals
- Learn how to perform Monte Carlo error propagation in Excel and learn some of its advantages over the partial derivatives method
- Understand and be able to explain the consequences of the assumption of linearity in the partial derivatives method
Tasks
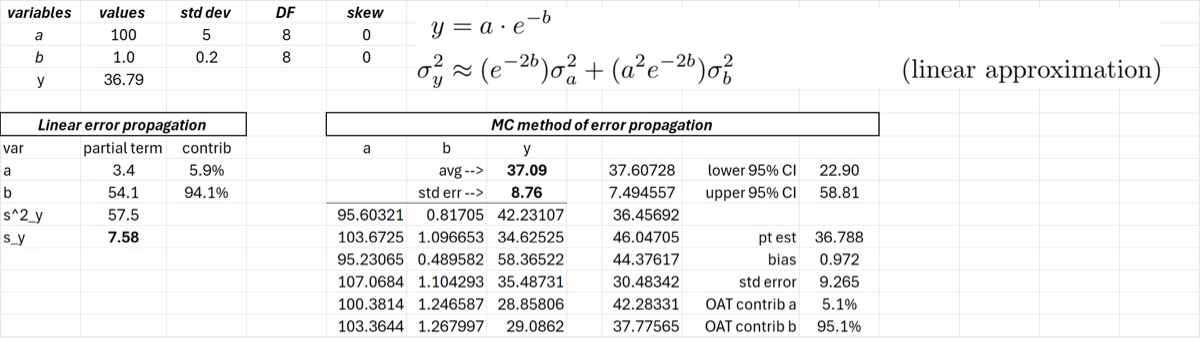
We will assume the following transformation: we have two random variables, and , and we are interested in the properties of the random variable calculated from these two variables as shown below. The estimate of using partial derivatives is also shown.
We are assuming here that the two variables and are independent. This is a transformation common to many scientific models. In the screencast we will perform the following tasks.
- Use
rerrorto demonstrate how the MC method works - Construct a named callback function to use in the CLS-Stats MC method functions
- Use
MCMto generate the simulated values and create a QQ plot (against standard normal) of the output - Examine the effect of skew on the output of the simulations
- Illustrate the use of
MCM_error_VandMCM_CI_Vfor error propagation
If you follow along with the screencast your spreadsheet should look like the image below.