Polynomial regression and model selection
Download: PolynomialRegression_init.xlsx
Introduction
Sometimes you don’t need a specific scientific/mathematical model of a phenomenon, you just want to get a good fit of the data. Polynomials are a common choice for this scenario because (a) they are linear regression models (no need for an iterative fitting procedure using SOLVER or something equivalent) and (b) they are versatile enough to fit a wide variety of phenomena. When using a polynomial model you have to choose which order is most appropriate for your data.
The general form for a polynomial regression model of order is:
where is the intercept term and is the coefficient for .
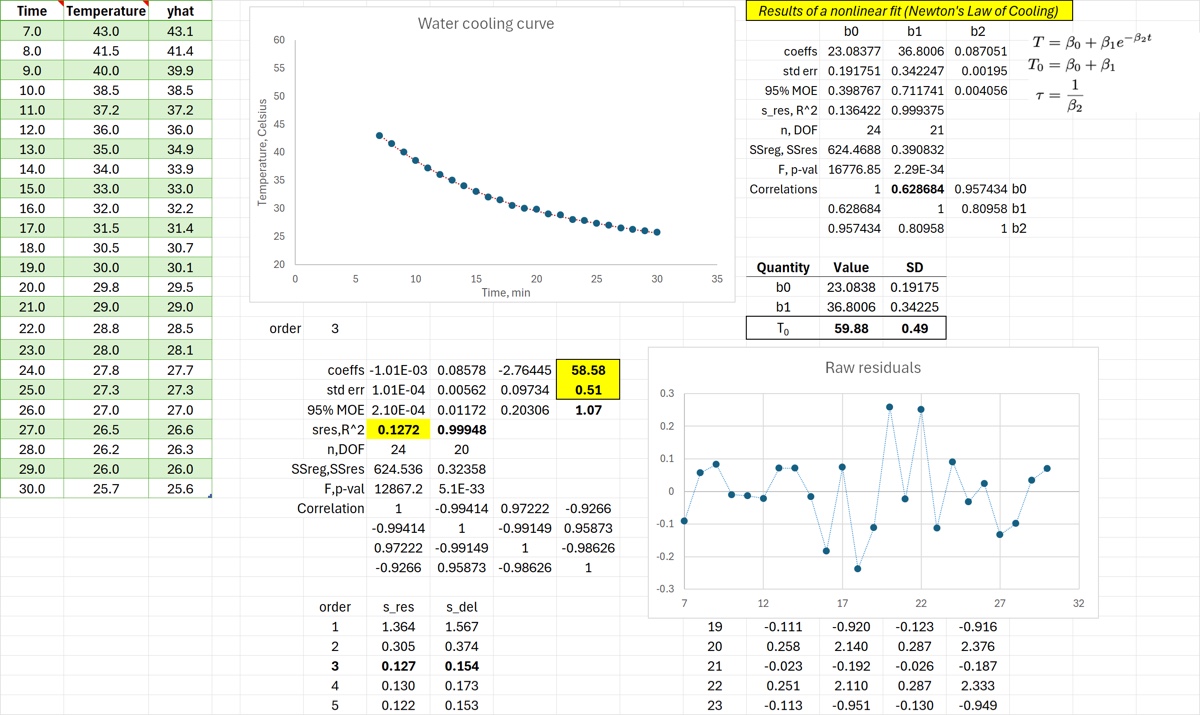
In this screencast we will explore different ways to fit a polynomial regression to data in Excel. We will also demonstrate visualization and statistical tools that we can use to determine the appropriate model (ie, polynomial order) to use for our data. As a case study we will use the same “Hot Stuff” cooling curve data that we previously used for nonlinear regression.
Learning Goals
- Learn how to do polynomial regression in Excel
- Learn how to assess and compare different regression models visually and with statistics
Tasks
- Perform polynomial regression with
LINESTandSEQUENCE - Use
PolyHatto add a polynomial fit to the plot - Use
PolyLSto perform polynomial regression and compare to the capabilities ofLINEST - Create a residuals plot with
PolyResidsand examine the effects of changing the order on the residuals - Calculate residual statistics using
PolySres - Based on visual and statistical evidence, choose the appropriate polynomial order for the data and report the initial temperature and its uncertainty
When you finish your spreadsheet should look something like the image below.