Outlier detection
Download: OutlierDetectionMethods_init.xlsx
Introduction
In this screencast we explore different criteria that can be used to flag outliers and we interpret those outliers in terms of probabilities.
Learning Goals
- learn what an outlier is and some common criteria for labeling points as outliers
- understand the phenomenon of outlier masking and how to avoid it
- learn to count and display upper and lower outliers according to various criteria
Tasks
- calculate outlier probabilities for (a) a single point and (b) at least one in points
- Note that I will not expect you to be able to do that last calculation but I do want you to appreciate that the probability of having at least one outlier in a sample is greater than the probability that any given data point will be an outlier
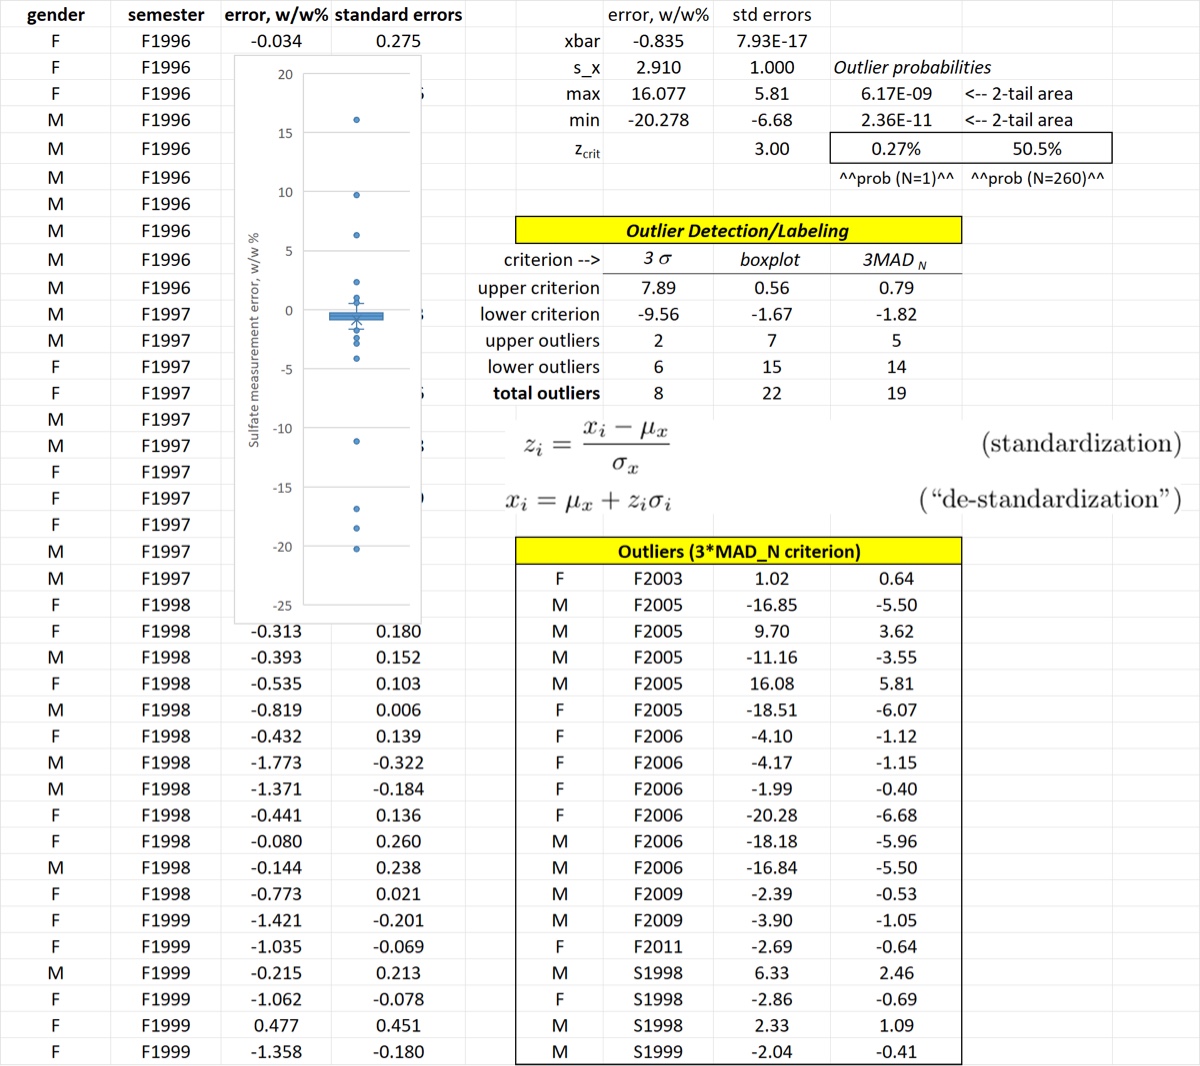
- calculate the number of upper, lower, and total outliers using the criterion
- display a boxplot of the measurement errors and compare the number of outliers to what you just calculated
- calculate the number of upper, lower, and total outliers using the boxplot criterion
- Note that you can use the new
BoxWhiskersfunction to help with this task. Check out the documentation.
- Note that you can use the new
- calculate the number of upper, lower, and total outliers using the criterion
- display the rows that are outliers (any criterion)
After the screencast your spreadsheet should look something like the one below.