Inverse regression 1
Download: InverseRegression1_init.xlsx
Introduction
A previous screencast covered a common situation: predicting (the dependent variable, which contains all the uncertainty) from (the independent variable, which is known exactly). Another possibility is to predict from an observation or measurement of . This is the “calibration problem,” also called inverse regression. The name comes from the fact that we are inverting the regression model function to predict (given the symbol ) from observation rather than the other way around.
Inverse regression is common in analytical chemistry. This is the first of two screencasts dealing with the principle of inverse regression and the corresponding calculations in Excel. In this screencast we will delve into the relationship between inverse regression and the prediction band, as illustrated in the figure below.
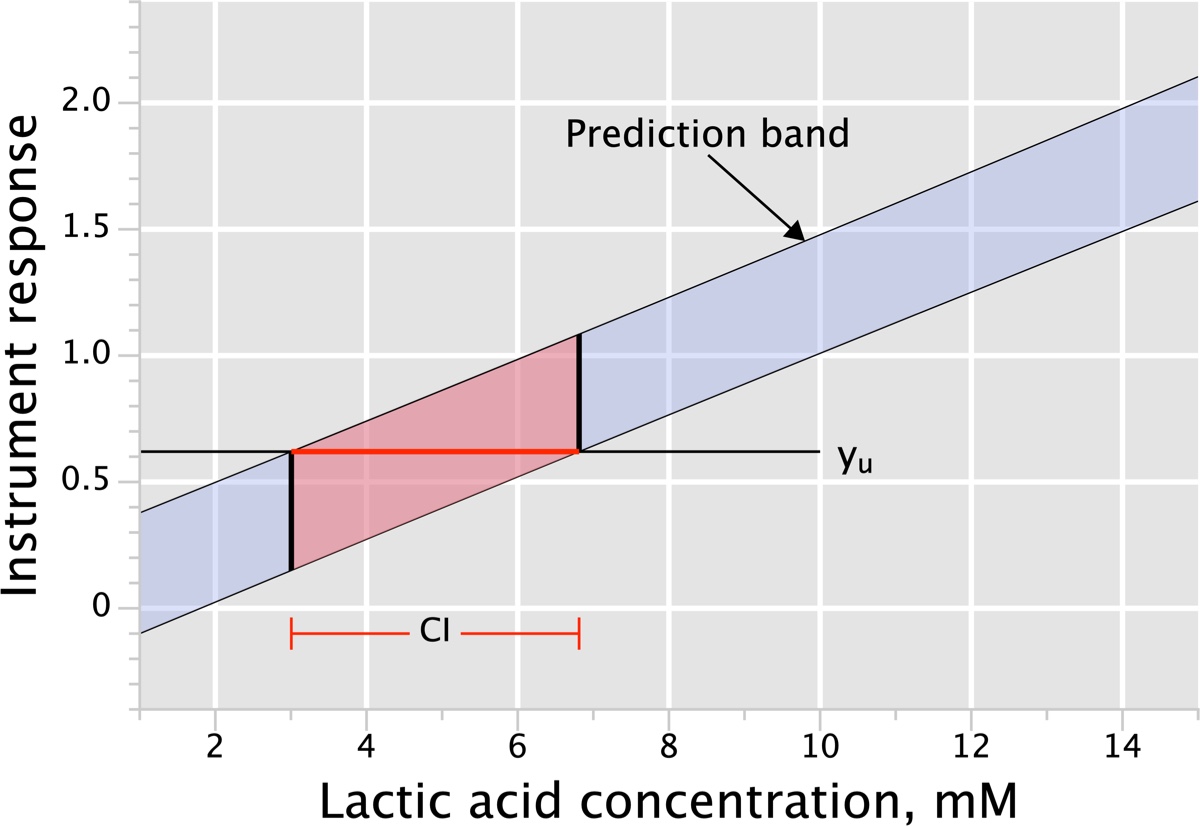
The task of determining the confidence interval (CI) for the true value is essentially to find all the values that generate a prediction interval (PI) that contains . These are the values that could have plausibly resulted in the measured value. So the CI boundaries occur when crosses the PI boundaries; numerically this is equivalent to finding the root(s) of a function.
Learning Goals
- Gain an understanding of inverse regression (the “calibration problem”) and how it relates to the prediction interval in regression
- Learn how to use
SOLVERwithPolyPredto calculate the 95% CI for the true value that resulted in measured value .
Tasks
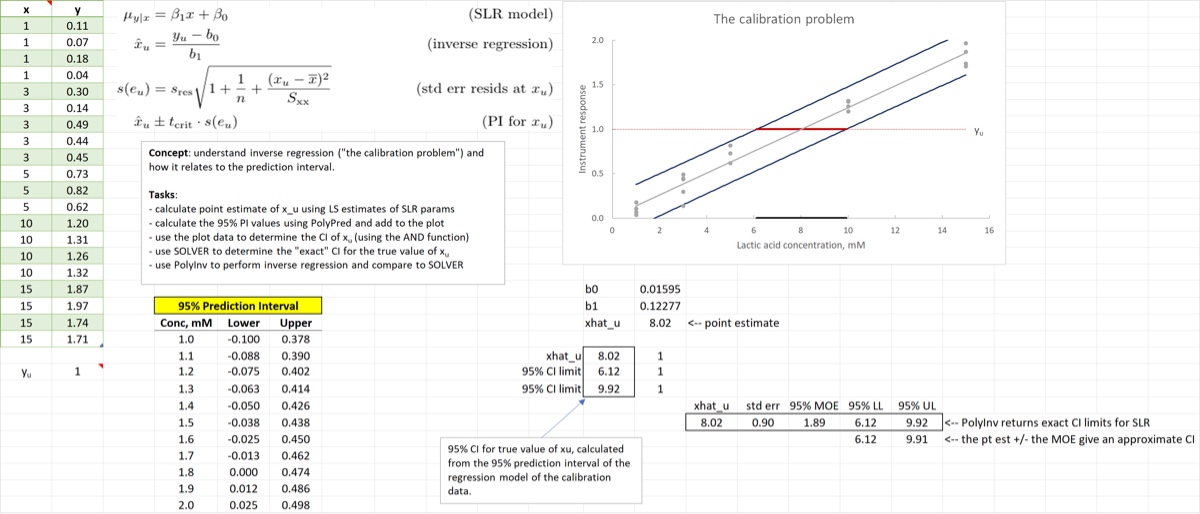
- Calculate the point estimate from the values of and of the best-fit line of the calibration data
- Calculate the 95% PI values for the calibration curve using
PolyPred(which will be automatically added to the plot) - Use the prediction band values (and the
ANDfunction) to estimate the CI for . Conditional formatting will appear to highlight the CI. - Use
SOLVERwithPolyPredto determine the 95% CI for - Use
PolyInvto perform inverse regression and compare the output of the function toSOLVER
Once you are done your spreadsheet should look something like the image below.