Filtering Data
Download: FilteringData_init.xlsx
Introduction
Filtering – displaying a subset of the data that satisfies some criteria – is a very common operation in data analysis. This screencast explores a number of ways to filter data in Excel.
Learning Goals
- learn (more) about filtering data in an Excel table, specifically using logical operations
- learn how to use the
FILTERfunction and its advantages over filtering in tables - learn the basics of “boolean algebra” and how it works in Excel. Learn Excel’s type conversions to or from boolean values.
- learn how to use boolean algebra combined with the
FILTERfunction to make sophisticated filters based on multiple criteria
Tasks
- Convert the data into an Excel table
- Display outliers “in place” (in the table) by filtering the rows displayed in the Excel table
- Display outliers with a cell formula that uses the
FILTERfunction with a single criterion - Display outliers with a cell formula that uses
FILTERwith boolean algebra to use multiple criteria
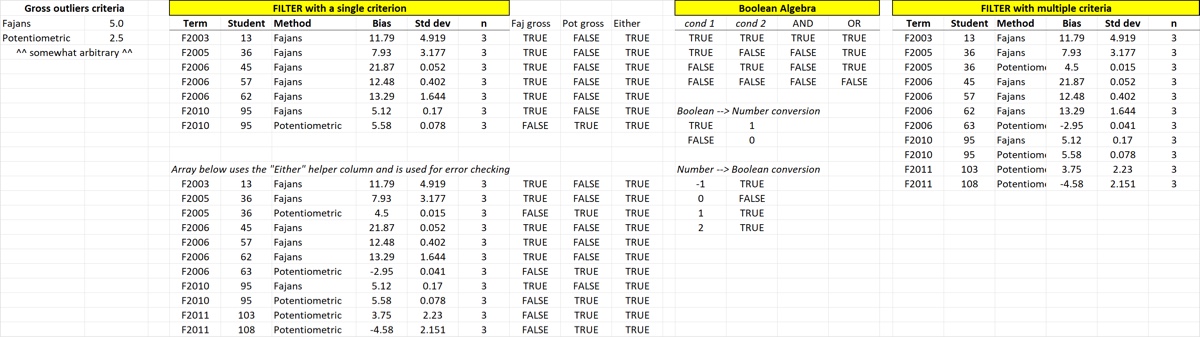
By the end of the screencast your spreadsheet should look something like the one below.