Excel Tables
Overview
Excel tables are often a convenient way to explore and analyze data. In addition, many Excel procedures like creating Pivot Tables and using Power Query require the data to be in the form of a table. In this screencast we show how to create a table and explore some of its properties and uses, as well as how to reference cells and columns within the table with Structured References.
Learning Goals
- learn what an Excel table is and how to create and use one
- learn how to format and name an Excel table
- learn how to filter and sort data in an Excel table
- learn about formulas within Excel tables, including Structured References
Tasks
- Create a table from the data. Name and format it to your liking.
- Best Practices note: I didn’t do this in the screencast but nowadays I almost always prefix my table names with
tbl, so for example the name of this table might betblSulfate. If all of your tables have the same prefix that makes it easier to filter for them in cell formulas and in other contexts (eg in the Name Manager). A common prefix I see others use on YouTube is “t” (eg,tSulfate).
- Best Practices note: I didn’t do this in the screencast but nowadays I almost always prefix my table names with
The tasks below are done inside the table
- Create a new column in the data (error) that is calculated from other table columns. Note the structured references in the formula.
- Explore sorting and filtering of data in the table, including custom sorts
- Create a totals row and use it to (a) count the semesters, (b) count the concentrations, (c) average the errors. Filter the data (by any criteria you want) and watch what happens to the totals row.
Outside of the table, do the following
- Write cell formulas for the number of unique concentrations and for the average error. Note the structured references.
- List the unique values for the True Concentrations, and count how many times each value occurs in the table
- Display only male students, and note what happens to the cell formulas you just created
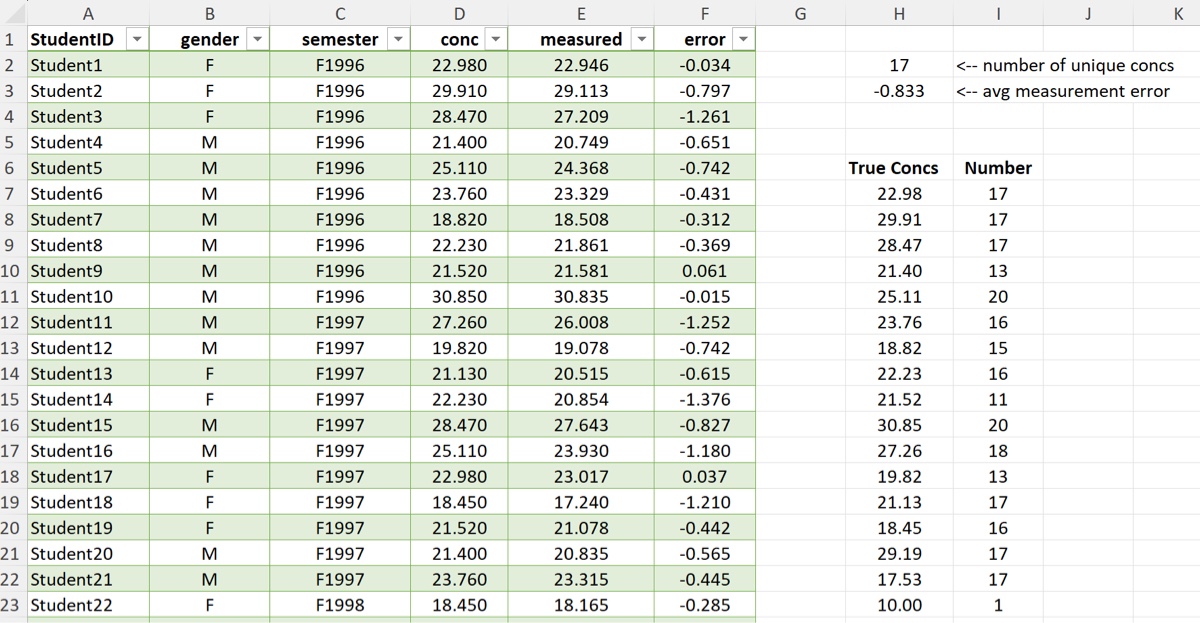
When you are done the top of your spreadsheet will look something like the image below. Not shown: the totals row at the bottom of the table.