Data pooling
Download: DataPooling_init.xlsx
Introduction
Data pooling is when statistics from multiple samples are merged to form a single, superior statistic that is used to estimate some shared population parameter. This screencast demonstrates how to pool variances from samples with different means but a common variance; we sometimes say that the different samples have homogeneous variance.
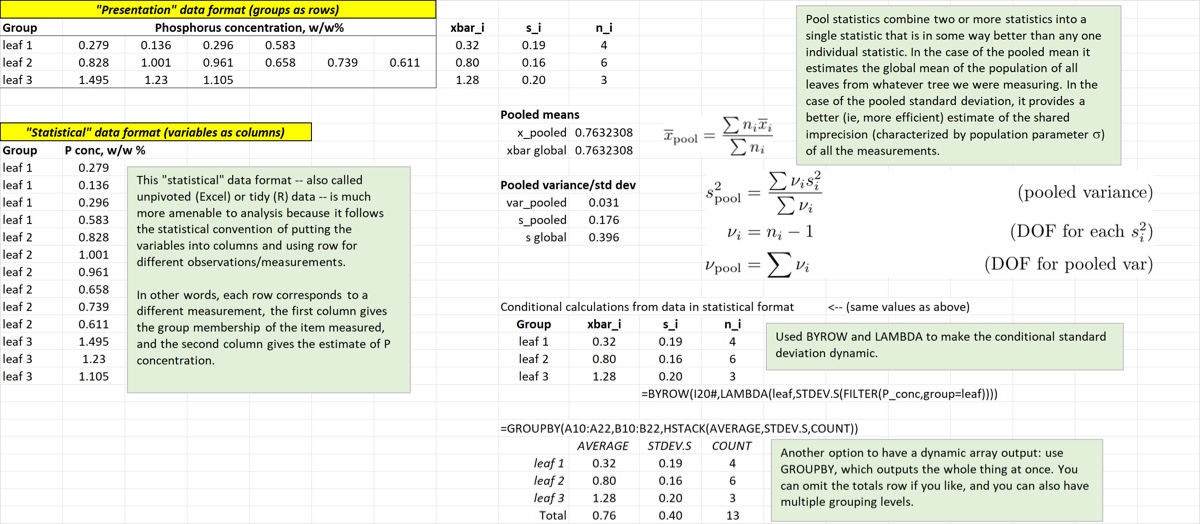
We will also demonstrate two ways that data are commonly structured in tables. I call them presentation and statistical data formats, though they are called other names as well (and I’ll mention them).
- the presentation data format is often just called the wide format. It is, in fact, the format often best suited for presentations. If the values in the table are aggregation statistics then sometimes this may be a cross-tabulation table; Excel calls them pivot tables in that case. The wide tables are easily grasped but they often have variables as column labels and this data format is unsuitable for many statistics procedures in both Excel and other statistical packages.
- the statistical data format is often called the long format. More recently it has been called the “tidy data” format but that is both a little misleading – it isn’t really that tidy! – and Hadley Wickham’s definition is a bit stricter. But the key characteristic is that in the statistical/long format the observations are rows and the columns are variables. Although not often well suited for display – they are often tall and skinny, like skyscrapers – the format of this table is better suited for many statistical functions and routines in Excel and other programs.
Learning Goals
- recognize the difference between wide (presentation) and long (statistical) table formats. Learn to use CLS-Stats
Unfoldto convert wide format to a long format - learn how to calculate pooled means and pooled variance from data in either format, and how to interpret pooled statistics
Tasks
- Convert the wide format (“presentation”) table to the long format (“statistical”) using
Unfold - Calculate group statistics for both sets of data. Extra: this isn’t shown in the screencast but try using
GROUPBYto calculate grouped statistics; see the image below. - Calculate the pooled mean and the pooled variance (and std deviation), as well as the associated degrees of freedom
By the end of the screencast your spreadsheet will look something like the image below.