Conditional Statistics 2
Download: ConditionalStats2_init.xlsx
Description
Sometimes you want to calculate statistics for a subset of the data that satisfy multiple criteria, and this screencast explores how to do that in Excel using COUNTIFS, AVERAGEIFS, and FILTER with boolean algebra.
Native Excel functions COUNTIFS, AVERAGEIFS, and SUMIFS can calculate specific statistics (count, mean, and sum, respectively) with multiple criteria. For other statistics (for example Excel’s STDEV.S or MEDIAN) you can use the FILTER function within the call to the function that calculates the statistic.
Note: You can also use Excel’s GROUPBY and PIVOTBY functions to achieve the same effects. They will be covered in the screencast on LAMBDA functions.
Learning Goals
- Learn the syntax of
COUNTIFSandAVERAGEIFS - Learn how to use the
FILTERfunction (with boolean algebra) to calculate statistics that satisfy multiple criteria
Tasks
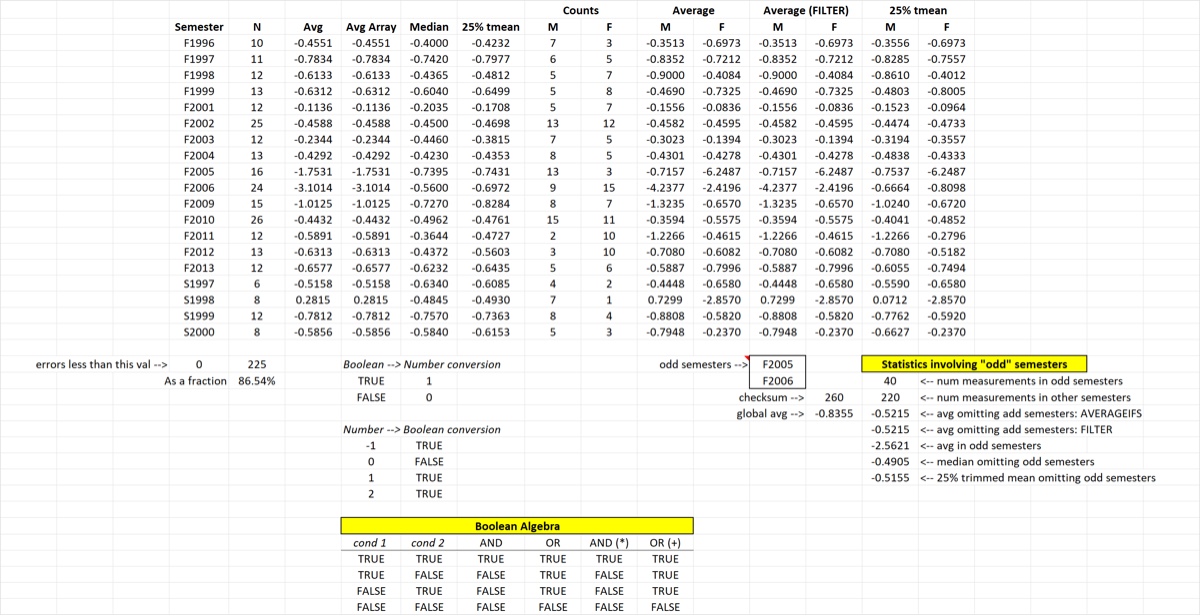
- Calculate the count by semester and gender using
COUNTIFS - Calculate the average by semester and gender using
AVERAGEIFS - Calculate the average by semester and gender using
FILTERand boolean algebra - Calculate the 25% trimmed mean by semester and gender using
FILTERand boolean algebra - Investigate the impact of building construction on the measurement error by calculating various conditional statistics
- the semesters during construction: F2005 and F2006
- calculate the number of measurements that were in those semesters and in all the other semesters
- calculate the average omitting the construction semesters
- calculate the median omitting the construction semesters
- calculate the 25% trimmed mean omitting the construction semesters
When you are done with this screencast your spreadsheet should look something like the image below.