Conditional Statistics 1
Download: ConditionalStats1_init.xlsx
Description
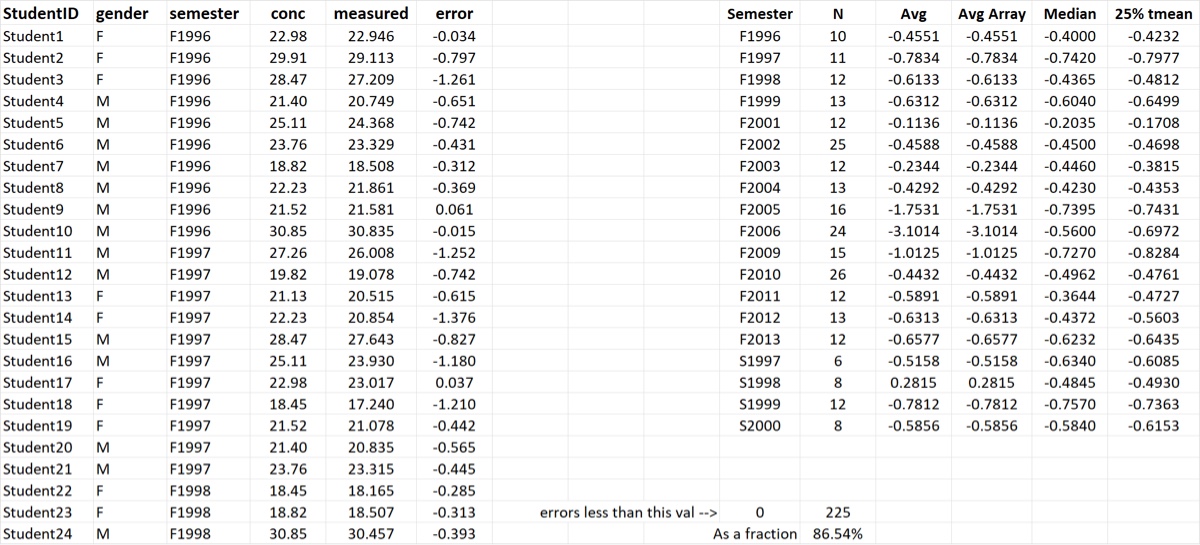
Conditional statistics are statistics of a subset of the data, a subset that meets certain criteria (“conditions”). In this screencast we will learn what native Excel functions exist for conditional statistics and how to calculate conditional statistics more generally, using the FILTER function to feed the data subset into the function that calculates the statistic.
Learning Goals
- Learn the syntax of Excel’s
COUNTIFandAVERAGEIFfunctions. - Learn how to use
FILTERto calculate any conditional statistic
Tasks
- List the unique semesters in the dataset (using
UNIQUE) - Use
COUNTIFto count the number of observations for each semester - Use
AVERAGEIFto calculate the average error for each semester - Use
FILTER+AVERAGEto calculate those same conditional averages - Use
FILTERto calculate the median and the 25% trimmed mean for each semester - Use
COUNTIFin a cell formula to calculate the fraction of errors that are negative
By the end of the screencast your spreadsheet should look something like the image below.