Comparison of variances
Download: Comparing-Variances-Slides.pdf
Download: ComparingVariances_init.xlsx
Introduction
Recall that scale statistics are scale equivariant. For scale statistic ,
In other words: if we multiply every value in a sample or population by a constant then the standard deviation (or MAD or IQR or…) of the transformed data will be multiplied by that same constant, relative to the original value.
Thus it makes sense that if we want to compare two scale statistics to see if they are significantly different (and to calculate bounds on the magnitude of that difference), we will want to create a comparison statistic that consists of the ratio of the two scale statistics.
The basis of today’s screencast is the creation of a parametric confidence interval for the ratio of variances. This is called an F-statistic and it is used to compare two standard deviations and :
If those two standard deviations estimate the same population parameter and if the underlying observations are normally distributed, then the above statistic follows an F-distribution. There are two parameters: degrees of freedom and of the numerator and denominator sample variances, respectively.
An example F-distribution is shown below, along with two critical values corresponding to tail-areas of 2.5%.
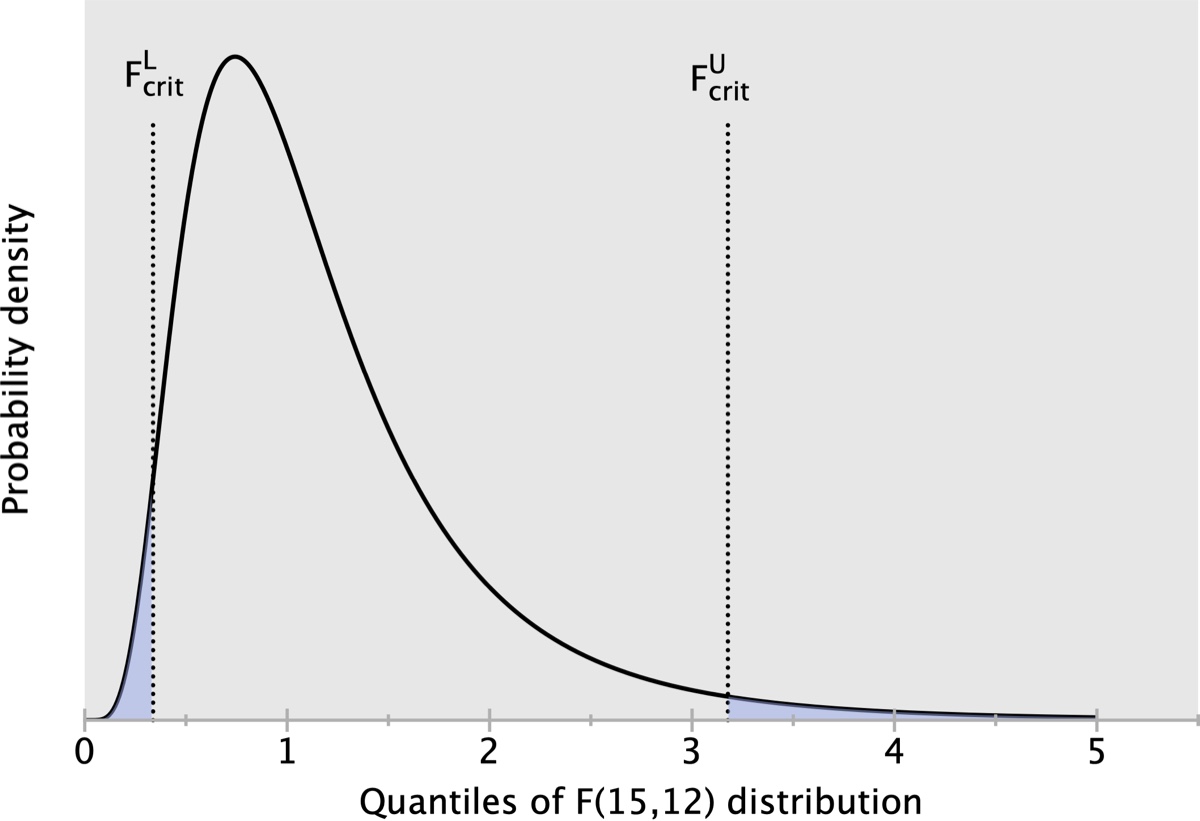
Critical values such as these are used to calculate a parametric CI for the ratio of variances:
If the resulting CI does not contain the value of 1 then there is a statistically significant difference in the two sample variances (and hence standard deviations). If the CI contains 1 then you have not detected a difference in variances.
Learning Goals
- Creating and using named formulas in Excel
- F-test: learn to create parametric confidence intervals to compare two sample variances. Understand the assumptions made by this test.
Tasks
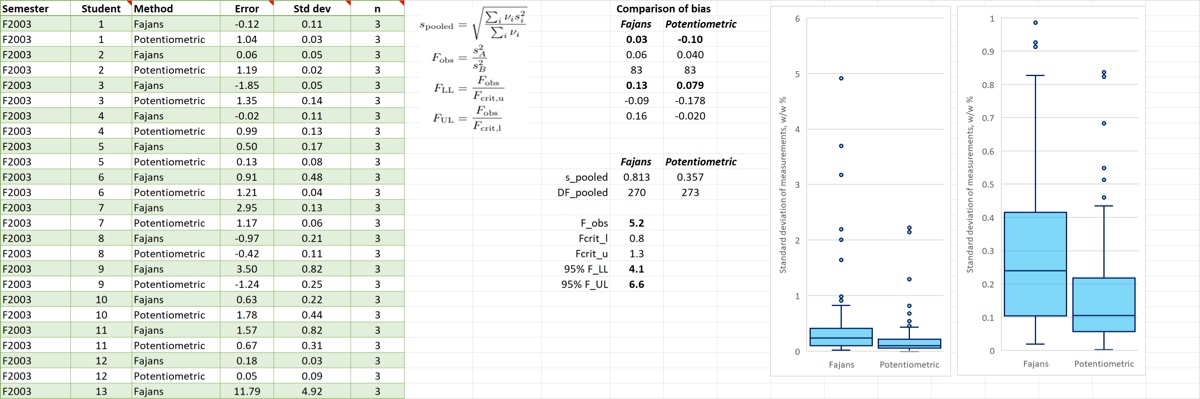
Ultimately what we want to do is create a parametric confidence interval that allows us to compare the “within-student” precision for using each endpoint detection method.
- Convert the data to a table. This is not completely necessary for the overall task but that’s what is done in the screencast. And XL tables are generally useful and are widely used (and allow for future expansion of ranges).
- Create named formulas, based on
FILTER~ing the table columns, for ~df_faj,df_pot,s_faj,s_pot. These will make our cell formulas match the equations more readily (fewer chances for errors, easier troubleshooting). - Use the named formulas to calculate the pooled standard deviations and their degrees of freedom
- Calculate our comparison statistic, , as the ratio of pooled variances for the two methods.
- Calculate the parametric 95% CI for the ratio of variances using the F-distribution critical values.