Callback Functions in Excel
Download: CallbackFunctions_init.xlsx
Introduction
In computer science, a callback function is a function that is passed as an argument to another function, and then used (“called”) as that function sees fit. In Excel, LAMBDA is a function that can be used to define an anonymous function when it is passed to other functions.
This formula pattern is powerful and has a growing number of uses in Excel. We will illustrate in this screencast using Excel functions GROUPBY and PIVOTBY, which can be used to calculate conditional statistics and create sophisticated cross-tabulations. We will also use lambda callback functions when we cover bootstrap statistics.
Lambda callback functions are used throughout the CLS-Stats add-in so it is crucial to become comfortable with Excel’s LAMBDA function and how it works. In particular, CLS-Stats uses callback functions in:
- all bootstrap functions, since the callback function returns the statistic that is bootstrapped;
- the Monte Carlo Method family of error propagation functions; and
- many regression functions, for example to define the regression model in nonlinear regression or to model measurement precision in weighted regression functions.
Learning Goals
- Introduce the following Excel native functions:
HSTACK,VSTACK,GROUPBY, andPIVOTBY. Show how these functions can be used to create group summaries and cross-tabulations (“pivot tables”). - Learn what an
etacallback function is in Excel - Show how
LAMBDAis used to define a callback function, usingGROUPBYandPIVOTBYas examples.
Tasks
- Name the columns (or create a table, your choice)
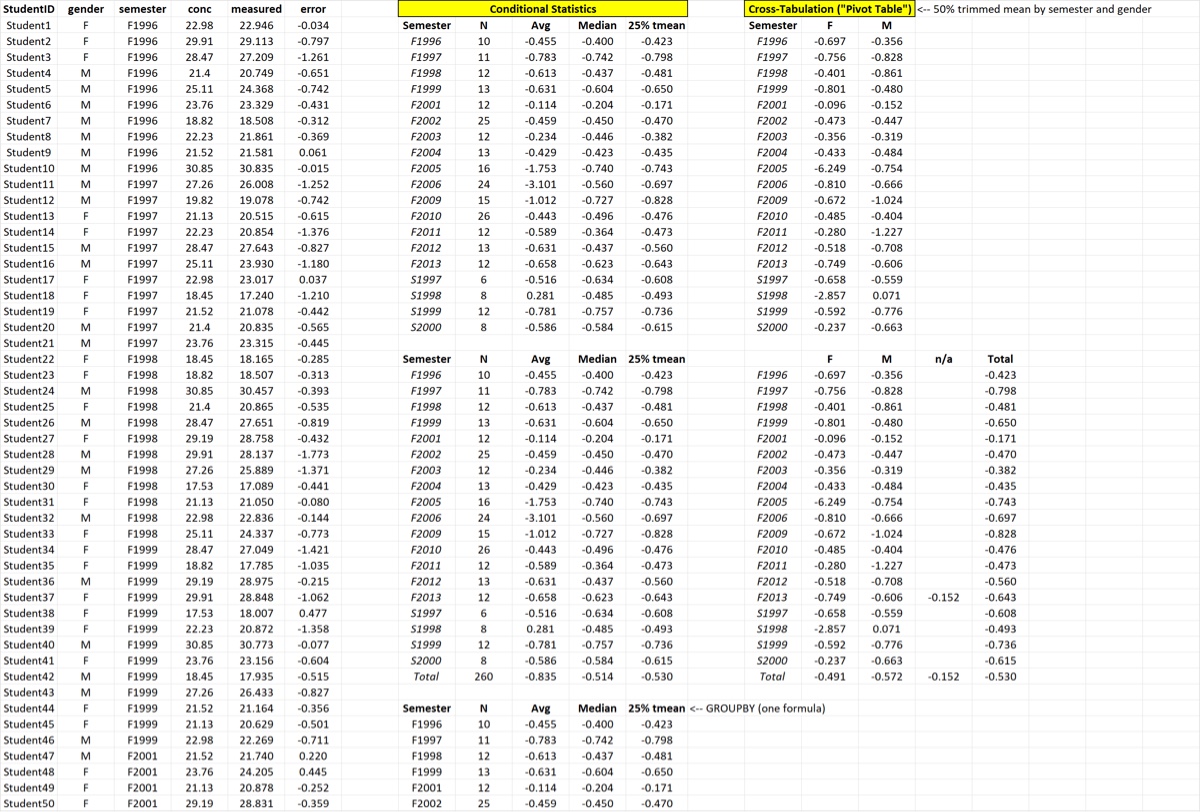
- Review: create a table of conditional stats column by column
- Do the same using
GROUPBYand callback functions (eta and lambda) - Use
GROUPBYand anHSTACKof callbacks to generate the table all at once - Review: create a two-way cross-tabulation of 25% trimmed means by semester and gender (cell by cell, with mixed address references)
- Use
PIVOTBYand a lambda callback function to generate the same table all at once
Once you are done the top of your spreadsheet should look like the image below.