Bootstrapping 2
Download: Bootstrap2_init.xlsx
Learning Goals
- learn how to manage spreadsheets with slow, volatile functions
- learn how and when to apply smoothing to a bootstrap
- learn more about the tradeoffs in choosing a location statistic
Tasks
- Calculate the KME (using
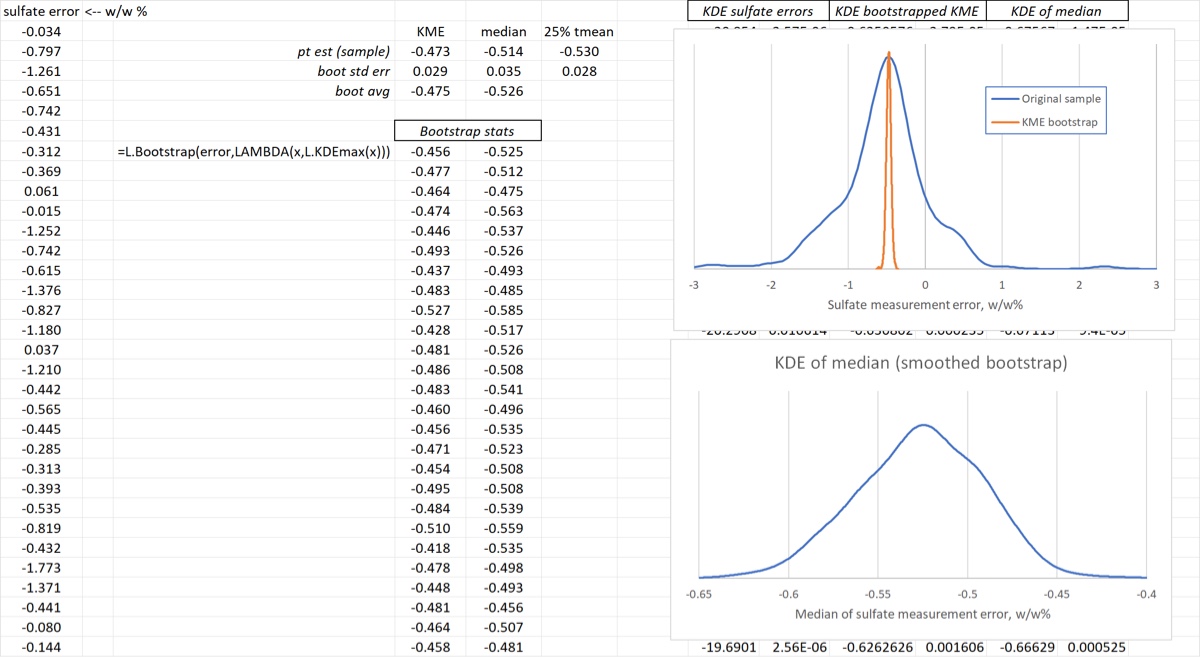
KDEmax) and the median of the raw data - Bootstrap the KME and control its volatility. Then use the bootstrap values to estimate the standard error of the KME.
- Add the distribution of the KME to the KDE plot of the raw data and compare
- Bootstrap the median then plot its KDE (in a separate plot) with a small bandwidth, say
bw = 0.5. Recalc repeatedly to note the multiple modes in the sampling distribution. - Change to a smoothed bootstrap and note the difference, and the effects of recalcs.
- Estimate the average and standard error of the median and compare to that of the KME
At the end of the screencast your spreadsheet should look something like the image below.