Bootstrapping 1
Download: Bootstrap1_init.xlsx
Download: Bootstrap-Slides.pdf
Introduction
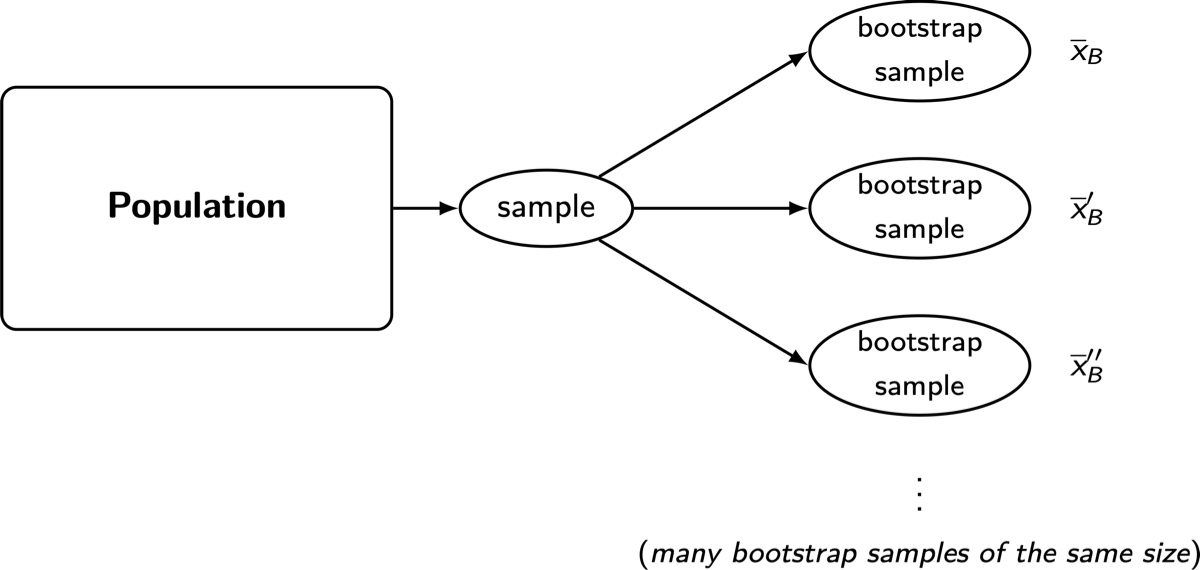
While simulations are useful for examining the behavior of statistics for a theoretical population, resampling techniques are used to predict the behavior of statistics for a given sample. The most important resampling method is bootstrapping, and the concept is illustrated in the figure below. A single sample is “bootstrapped” by repeated resampling with replacement. For each bootstrap sample you calculate a statistic. The idea is that the distribution of bootstrap statistics will mimic the sampling distribution you would have observed if you had resampled the original population directly.
In this screencast we will illustrate bootstrapping in Excel using the CLS-Stats add-in.
Learning Outcomes
- Understand what a bootstrap sample is
- Understand the purpose of bootstrapping and how to execute it in Excel
- Understand how to estimate the standard error from the bootstrap statistics
Tasks
- Illustrate bootstrap samples with the
BootSampleCLS-Stats function - Calculate the mean and 50% trimmed means, and estimate their standard errors
- Bootstrap those statistics and compare the results to the previous results
- Compare the distributions using a boxplot
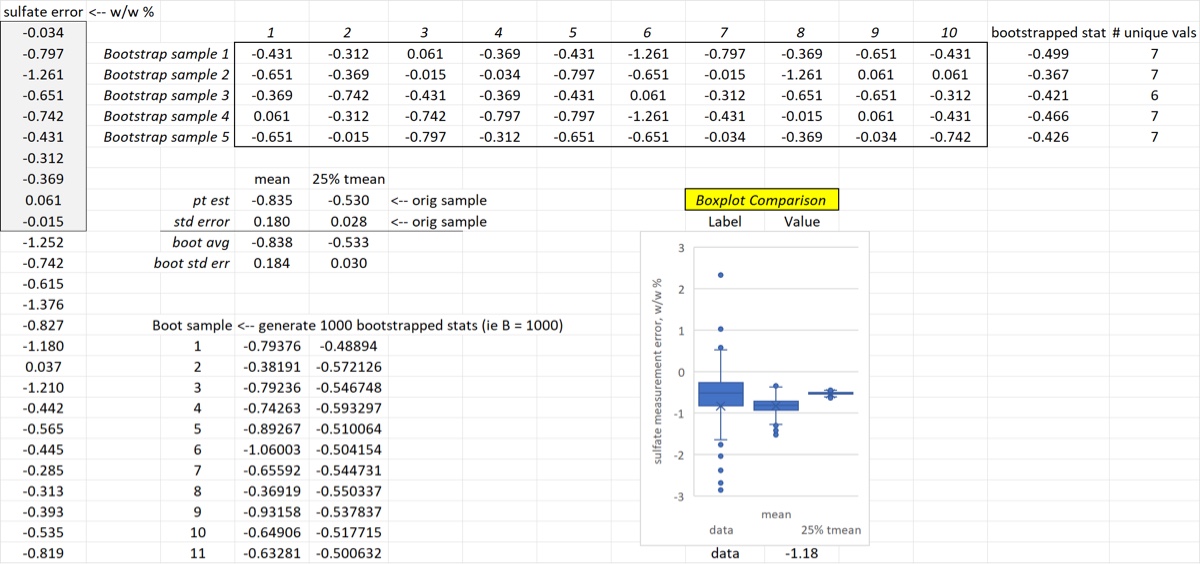
When you finish the screencast your spreadsheet should look something like the image below.