Arrays in Excel 1
Download: ArrayFormulas1_init.xlsx
Introduction
In Excel, an Array is a collection of more than one item. They can be row vectors, column vectors, or matrices/tables. Many times a cell formula will produce multiple values that will spill into neighboring cells as an array. This screencast introduces you to arrays and array operations.
Learning Goals
- learn what an array is and how a cell formula can produce an array.
- understand the dynamic nature of arrays, and array address notation like
A1# - understand what causes
#SPILL!errors and how to fix them - learn how to use Excel’s
SEQUENCEfunction - learn how to subset an array using Excel functions
INDEX,TAKE,DROP,CHOOSECOLS, andCHOOSEROWS - understand “array operations” (what MS terms Lifting and Broadcasting)
More: About Lifting and Broadcasting
Microsoft uses three terms to describe specific types of array behaviors. I tend not to use these terms – I always forget which is which! – but thought I would share them with you. Even if you don’t know the terms you have to understand the behavior they describe.
The examples below use array constants in the input but they could just as easily be ranges of cells in the spreadsheet.
Lifting refers to how functions deal with array inputs when they are expecting scalars. An example is the LEN function below: it returns answers for each item in the input array or in a range of cells.
=LEN({"dog";"kitten";"fish"})
={3;6;4}
Pairwise lifting is a special case of lifting. An example is shown below, where line 2 shows the intermediate result of the cell formula in line 1 (and line 3 is the final result).
=SQRT({1;2;3}+{3;7;13})
=SQRT({4;9;16})
={2;3;4}
Broadcasting refers to how a smaller array is resized in an operation involving two or more arrays:
=B5:B7*D5 // starting formula
={2;4;6}*2 // initial evaluation
={2;4;6}*{2;2;2} // broadcasting
={4;8;12} // final result
Tasks
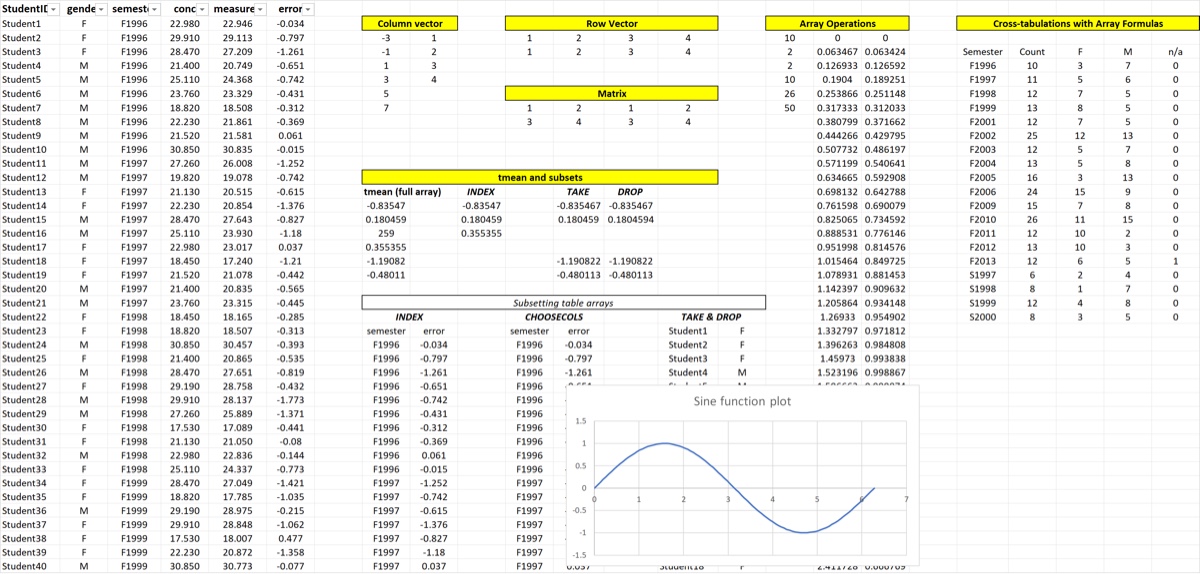
- Use
SEQUENCEto create a column vector, a row vector, and a matrix - Use array constants to create a column vector, a row vector, and a matrix
- Purposely generate a
#SPILL!error for any of the above outputs and learn how to identify the spill range from those errors - Use
L.tmean()on the measurement errors. Then take subsets usingTAKE,DROP, andINDEX. - Use
INDEXandCHOOSECOLSto take subsets of the data table - Demonstrate array broadcasting by performing math in a cell formula on one of the arrays generated by
SEQUENCE - Demonstrate array lifting by creating a sine function plot between 0 and .
- Aside: Explore CLS-Stats functions
SeriesandRangeas alternatives toSEQUENCEfor this purpose. I added those functions after this screencast was made as convenient wrappers forSEQUENCE. Personally in this situation I would probably use=L.Range(0, 2*PI(),100)as a quick way to generate 100 points between the two desired endpoints.
- Aside: Explore CLS-Stats functions
When you are finished your spreadsheet should look something like the image below.