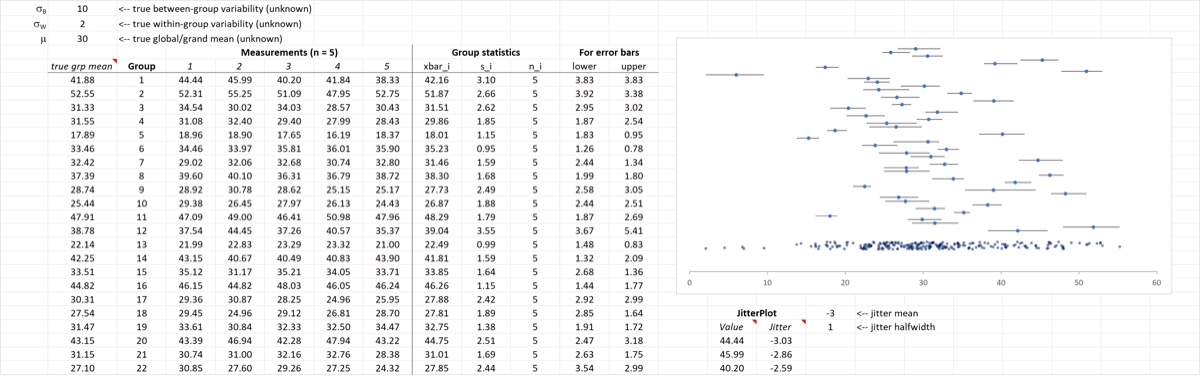
ANOVA demonstration
Download: ANOVA_demo_init.xlsx
Introduction
When you collect a series of measurements you often have two sources of variability:
- uncertainty introduced in the measurement process
- variability due to changes in the value being measured
These two sources of variability can be separated and quantified by Analysis of Variance (ANOVA). In this screencast we will build a simulation of ANOVA-type data that we will analyze later.
Tasks
- Generate the true means for each group; the function should be volatile.
- Use
rerrorVto generate measurements on each group - Plot the data on an XY scatterplot, with the measurement values on the axis. Get rid of gridlines.
- Add the jittered data underneath the plot and then lose the axis
- Create and add error bars that stretch from the minimum to the maximum values in each group
When you are finished your spreadsheet should look like the image below.