Kernel Density Estimate
Keyboard shortcut: Ctrl-Shift-K
Description
This procedure presents a UI that will create some Excel formulas on the worksheet and create a plot that displays the KDE, and possibly either a boxplot or a jitterplot, of the input data. It effectively presents a UI where one can generate cell formulas that use the lambda function Density along with BoxplotXY and/or JitterPlot and plots the results.
Note that KDEs as estimates for the probability density suffer well known shortcomings near boundaries and when estimating the mode of highly skewed data; decreasing the bandwidth can reduce those shortcomings at the expense of more noise. Refer to the documentation of Density and KDEmax for more detail.
Use
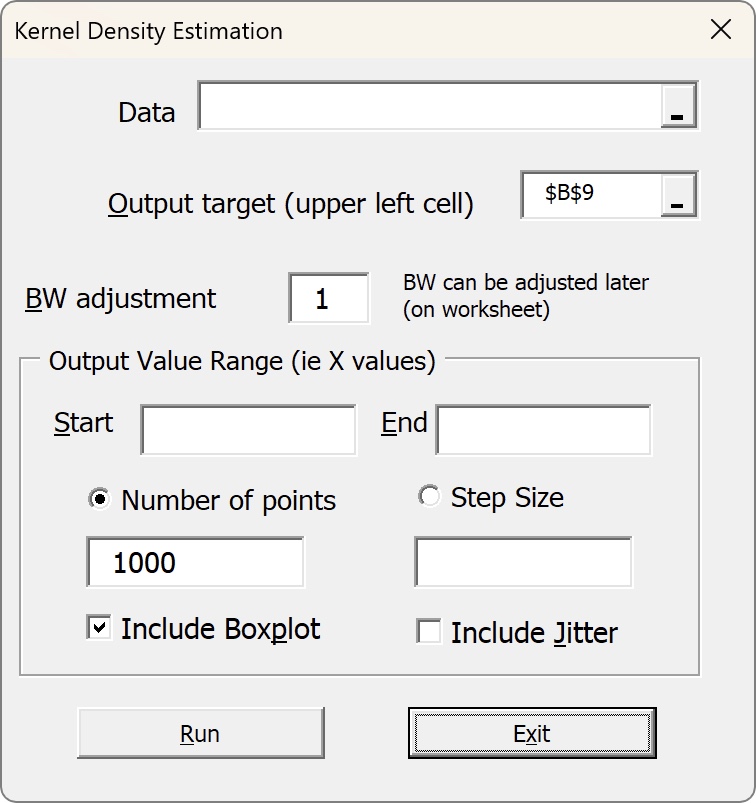
This procedure presents a UI that will create some Excel formulas on the worksheet and create a plot that displays the KDE, and possibly either a boxplot or a jitterplot, of the input data. Selecting this item, or using the keyboard shortcut Ctrl-Shift-K, will launch the form shown below.
- the
Datafield contains the address of the cells containing the data that you want to plot. You can enter the address manually or you can click on the icon to the right of the field. Unfortunately the navigation keys to select a block of cells do not work so you need to use the mouse. If you have a large amount of data to select it is strongly recommended that you name it and simply type in the name. As you navigate away from the data input field it will change to an address (or give you a warning message if it doesn’t recognize the name). If you have the data in a dynamic array you can enter an address likeA1#to select the entire address, and the procedure will recognize that. - the
Output targetis the upper left cell of the output cell formulas that the procedure will generate for the plot. The procedure will warn you if data in the spreadsheet will be overwritten and you can either allow that or choose another location. - the
BW adjustmentis the samebwargument that is used in theDensitylambda function. - the
StartandEndvalues are arguments also passed to theDensitylambda function. When you select data and navigate away from that field, default values will populate theStartandEndinputs but you can of course override these values. - You can either enter a
Number of pointsvalue or aStep Sizevalue, but not both. If you enter the number of points (or accept the default of 1000) then the step size will be automatically calculated for you. If you want to override that step size you can do so…but the number of points will be calculated from that. - In addition to the KDE plot you can add a horizontal boxplot and/or a jitterplot below the KDE plot. You can add both of them though that isn’t really recommended since the resulting plot will be quite busy.
When you click the Run button, cell formulas will be created and the results will be used to create the plot(s). The main plot is created with the Density lambda function; the other two plots are created with BoxplotXY and/or JitterPlot. If a required function is not already in the workbook, it will be copied from the add-in.
Example
An example of the output is shown below. The Density formula refers to the cell labeled “BW adjust” which can be used to adjust the kernel width; see the Density function documentation for more detail. The position and width of the horizontal boxplot are adjusted by the cells labeled “BP offset” and “BP width”. Cell comments in those cells also explain this.
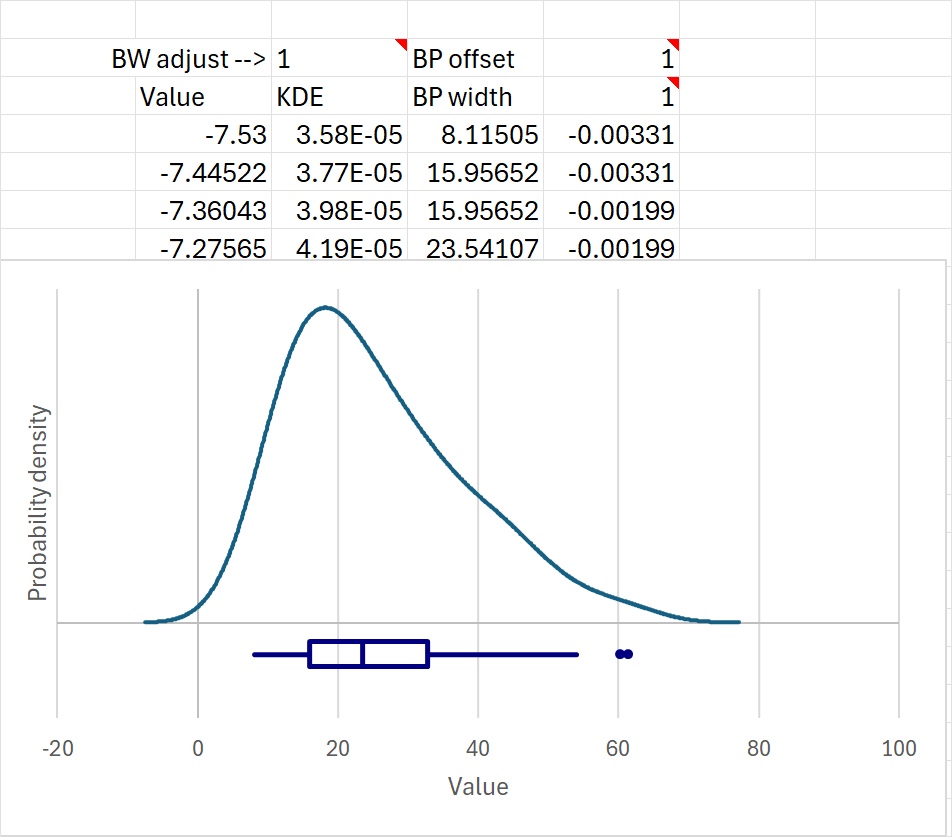
One key aspect of this file: while only a person with the CLS-Stats add-in can call this VBA procedure to generate this plot, once it is generated it can be shared with anyone even if they don’t have the add-in. And it is dynamic, responding to changes in input data or parameters like bandwidth.