WLS
Description
WLS is a weighted LS version of OLS. It performs weighted least-squares regression with the exact same output as OLS. The weights are entered as standard deviations, S, and the weights are ; to use weights directly, pass S = 1/SQRT(w). Only the relative sizes of the standard deviations matter; multiplying all of them by a constant changes but not the other statistics. As with OLS, a row containing a non-number (in Y, X or S) is removed.
In weighted least squares, the weighted sum of squared residuals () is minimized to obtain the best fit. When the weights are , with being the (true) standard deviation of measurement , then the regression parameter estimates are BLUE (ie, the best linear unbiased estimators of the regression parameters). The standard deviations can be scaled and achieve the same effect as long as their relative values are unchanged.
Syntax
WLS(Y, X, S) where
Yis the response variable, as a column vector, andXcontains the explanatory variables (as columns)Sis a column vector of the standard deviations of theYvalues; all of them must be positive, or an error message is returned
The output of the function has the same format as OLS and the documentation of that function should be consulted. One difference in meaning is that , and SSreg are calculated from the weighted sums of squares about the weighted mean of . The standard deviation of the residuals, , is a useful diagnostic. If the std devs (the elements of S) are in the same units as , then it is the square root of the reduced chi-square, . If is close to 1, then the values are consistent with the spread of the residuals around the fit. If the value of is significantly greater than 1 then it may mean one of two things (possibly both).
The regression model does not account for all of the systematic variability in the data. Model mis-specification can be revealed by examination of the residuals for systematic variation.
The uncertainty in the values is greater than the reported values. This might be the case, for example, with false replication, where replicate observations (or other estimates of measurement precision) do not fully capture all of the sources of variability of the measurements.
If then it means that the values are too large.
Example
Our example uses synthetic data to simulate a set of experiments in which reaction rate constants are estimated at different temperatures . A scientific model of this dependence is
where is the pre-exponential factor, is the activation energy for the reaction, is the ideal gas constant, and is the absolute temperature. We are interested in estimating and obtaining an accurate estimate of its standard error.
The Arrhenius equation is often linearized in an Arrhenius plot of as a function of :
is estimated from the slope of the plot, and its standard error from the standard error of the slope.
In our data we have estimates of each measurement. Since each value is obtained by something like a 1st-order decay curve (or a similar fit), the measurements used to estimate can also be used to estimate its standard error. Propagation of error can then be used to obtain the standard errors of the values, and hence used for the weights in WLS regression.
The image below compares the results of WLS with those of OLS, which is unweighted. The point estimates of are similar but their standard errors are quite different. This is a common situation in comparisons of the two, since OLS estimates are unbiased even for heteroscedastic data, but the OLS standard errors are not reliable when the variance is not constant.
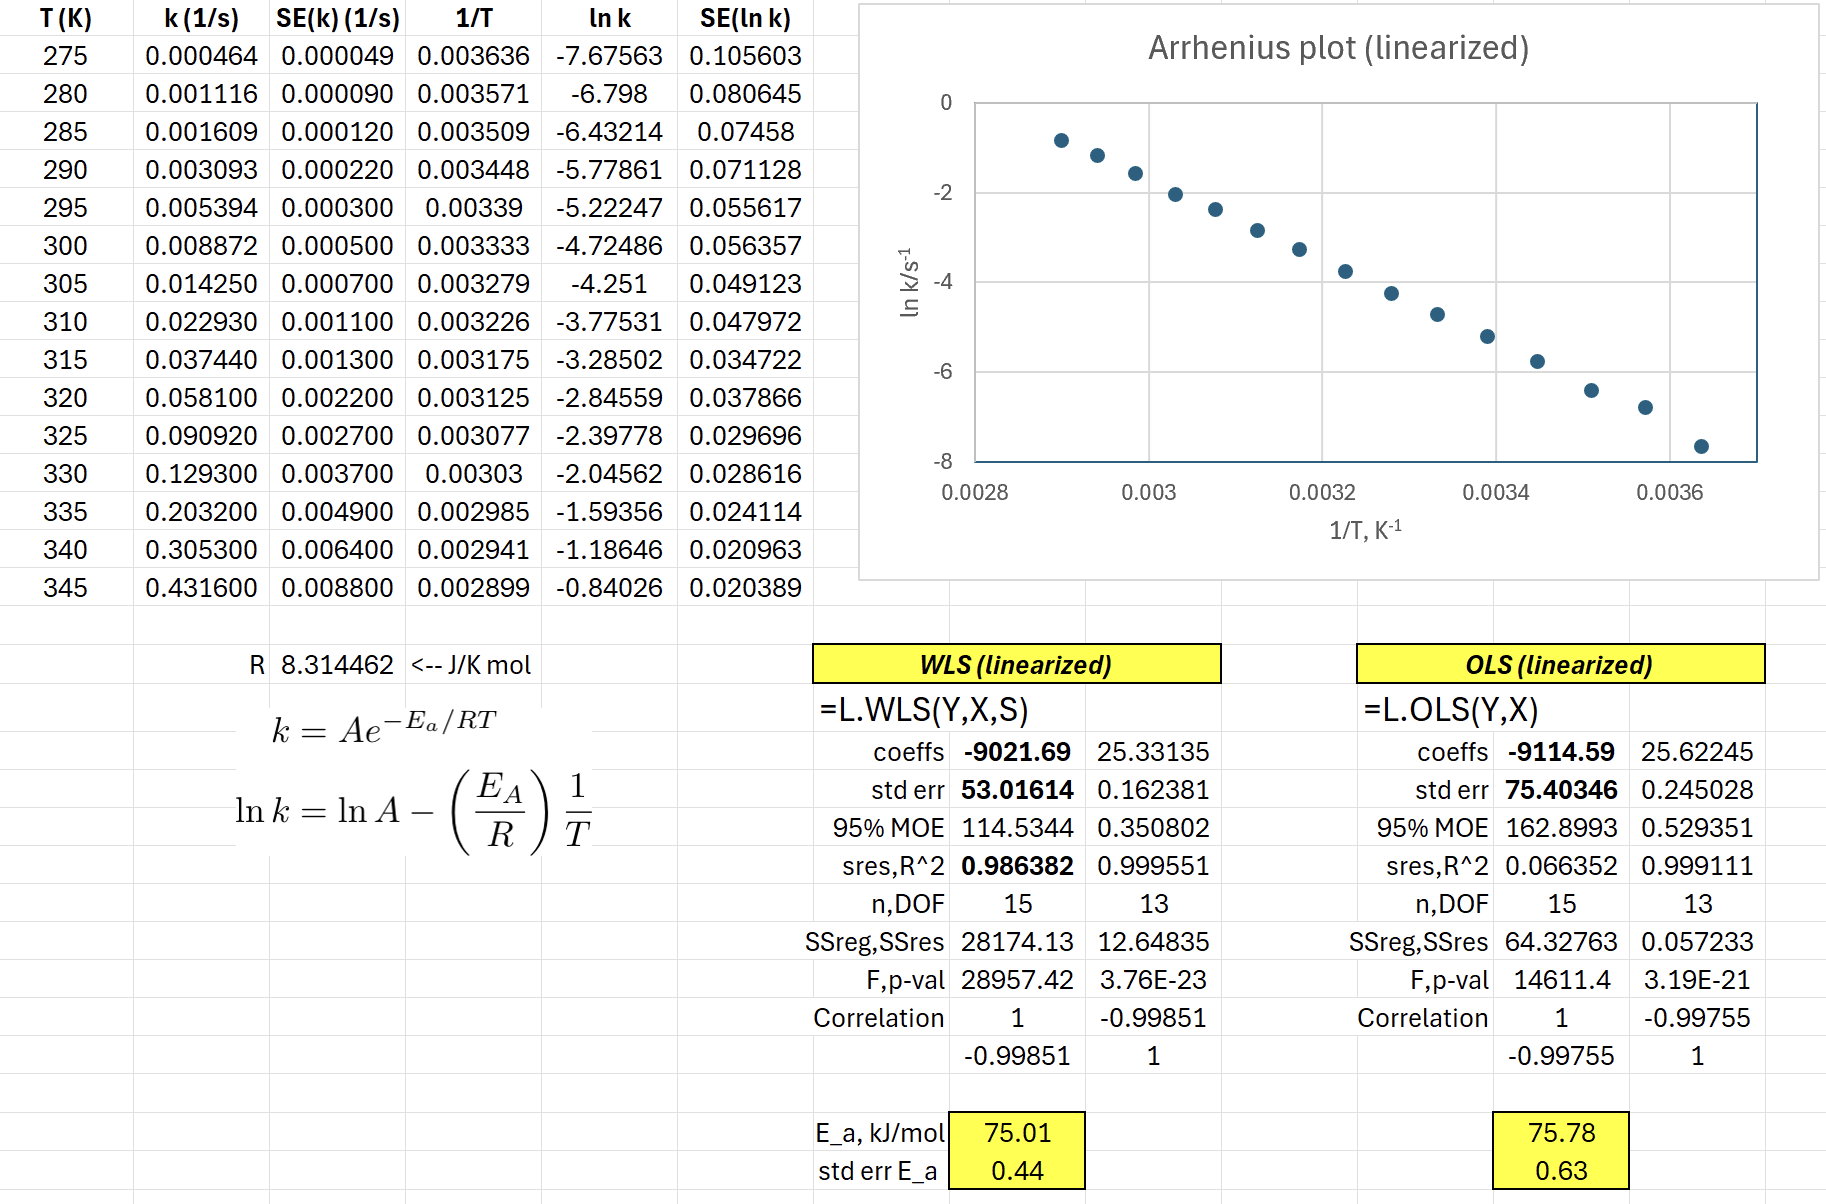
Note in this example that the value is close to 1, meaning that the estimated standard errors (of ) are consistent with the size of the residuals. In other words, there doesn’t seem to be a false replication issue and the model looks to be a good fit. (Not a surprising result for synthetic data!)
Download: WeightedLeastSquares.xlsx
Source Code
WLS = LAMBDA(
    Y, // dependent values as a column vector
    X, // independent values, can be multiple columns (one per variable)
    S, // std devs of the Y values, as a column vector
    LET(
        // get indices of valid rows for X, Y and S inputs
        Xind, BYROW(X, LAMBDA(X, PRODUCT(--ISNUMBER(X)))),
        NumFilter, Xind * ISNUMBER(Y) * ISNUMBER(S),
        // only keep valid rows
        Xn, FILTER(X, NumFilter),
        Yn, FILTER(Y, NumFilter),
        Sn, FILTER(S, NumFilter),
        wt, 1 / Sn ^ 2,
        rw, SQRT(wt),
        n, ROWS(Yn),
        p, COLUMNS(Xn),
        // LINEST on the weighted system (every row scaled by SQRT(w));
        // the SQRT(w) column takes the place of the intercept
        m, DROP(LINEST(Yn * rw, HSTACK(rw, Xn * rw), FALSE, TRUE), , -1),
        labels, {
            "coeffs";
            "std err";
            "95% MOE";
            "sres,R^2";
            "n,DOF";
            "SSreg,SSres";
            "F,p-val";
            "Correlation"
        },
        coeffs, CHOOSEROWS(m, 1),
        stderrs, CHOOSEROWS(m, 2),
        sres, INDEX(m, 3, 2),
        DOF, INDEX(m, 4, 2),
        SSres, INDEX(m, 5, 2),
        MOE, stderrs * T.INV.2T(5%, DOF),
        // X matrix in LINEST order (reversed columns, then ones)
        Xr, IF(p > 1, INDEX(Xn, SEQUENCE(n), SEQUENCE(, p, p, -1)), Xn),
        Xm, HSTACK(Xr, Ones(n, 1)),
        // weighted SSreg about the weighted mean of Y, then R^2 and F
        yhat, MMULT(Xm, TRANSPOSE(coeffs)),
        ybar_w, SUM(wt * Yn) / SUM(wt),
        SSreg, SUM(wt * (yhat - ybar_w) ^ 2),
        Rsqr, SSreg / (SSreg + SSres),
        Fobs, SSreg / p / sres ^ 2,
        pval, F.DIST.RT(Fobs, p, DOF),
        // correlation matrix of the coefficients
        Cov, MINVERSE(MMULT(TRANSPOSE(Xm * wt), Xm)) * sres ^ 2,
        Dinv, MDiag(1 / stderrs),
        Corr, MMULT(MMULT(Dinv, Cov), Dinv),
        // IFERROR used to avoid N/A values
        output, IFERROR(
            VSTACK(
                coeffs,
                stderrs,
                MOE,
                HSTACK(sres, Rsqr),
                HSTACK(n, DOF),
                HSTACK(SSreg, SSres),
                HSTACK(Fobs, pval),
                Corr
            ),
            ""
        ),
        IF(
            OR(Sn <= 0),
            "ERROR: std devs must be positive",
            IFERROR(HSTACK(labels, output), "")
        )
    )
);