ValueCounts
Description
ValueCounts lists the number of unique items in a list and how many times they occur. Typically this is applied to categorical data (eg a grouping variable). The result can be displayed as a raw count or as a proportion, and can be sorted by first or second column.
Syntax
ValueCounts(data, [proportion = FALSE], [ascending = FALSE]) where
datais the input data (any shape)proportionis a boolean that determines whether a raw count (the default) or a fraction is returnedascendingis a boolean that determines whether the output is sorted by descending counts (or proportion), the default, or whether it is sorted alphabetically by the values.
Example
While ValueCounts is typically applied to non-numeric data (the first two use cases below), there is no reason it can’t be applied to numeric data (last case).
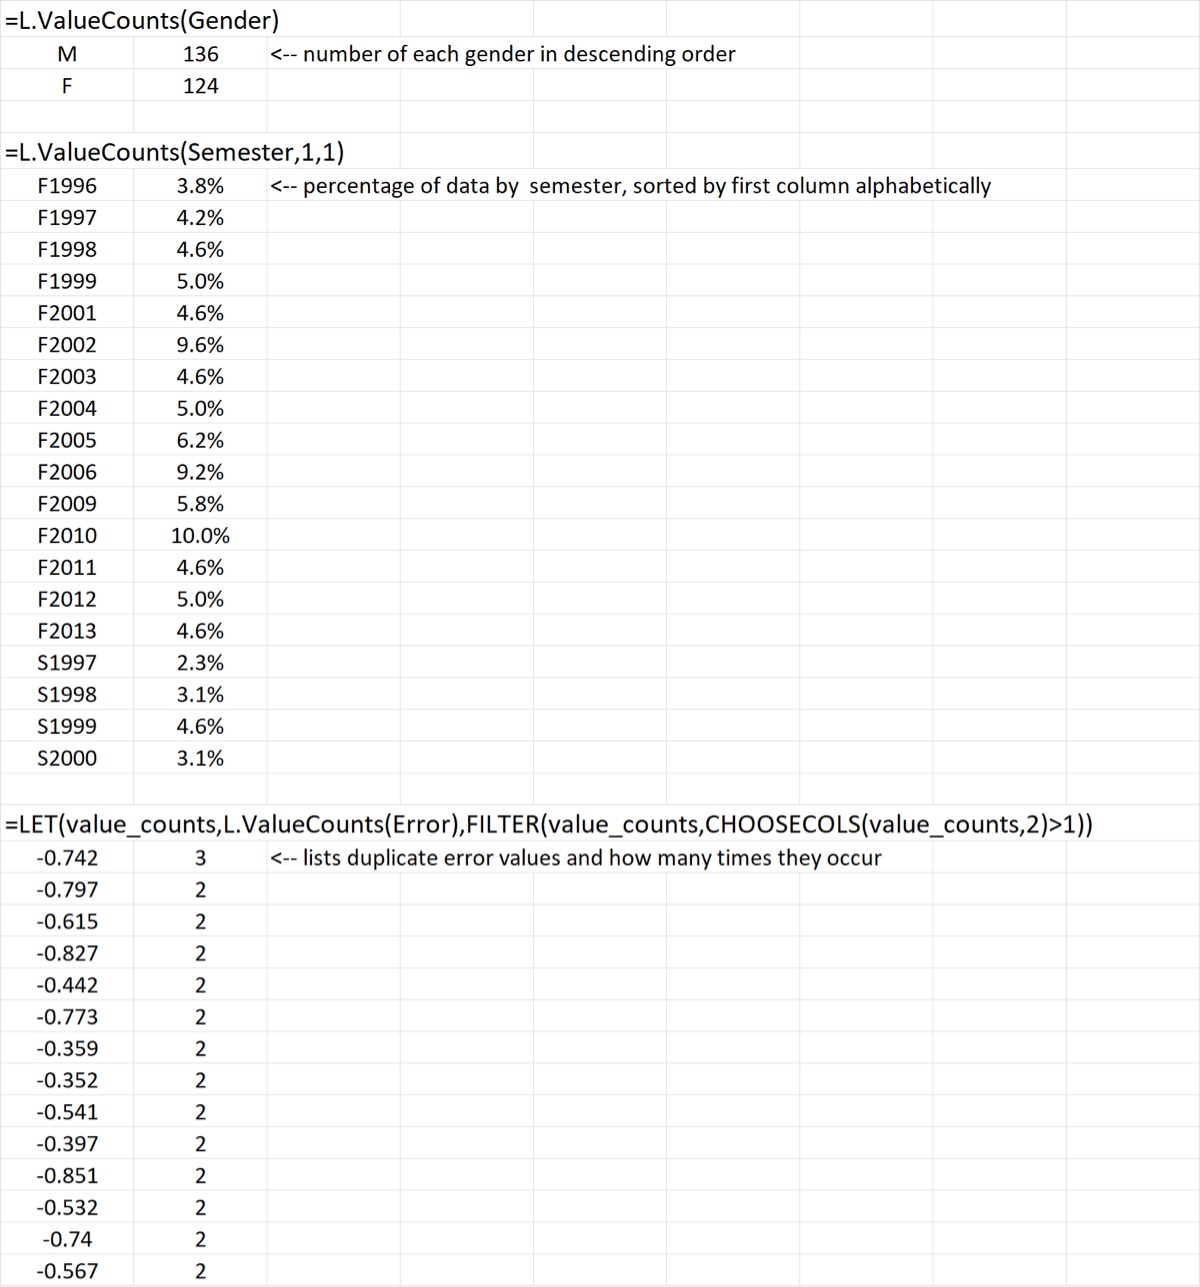
Download: ValueCounts.xlsx
Source Code
ValueCounts = LAMBDA(
    X,              // input data (any shape)
    [proportion],   // normalize to fraction of total (default false)
    [ascending],    // when FALSE sort output by descending counts
    LET(
        proportion, IF(ISOMITTED(proportion), FALSE, proportion),
        ascending, IF(ISOMITTED(ascending), FALSE, ascending),
        // convert input to column vector
        Xc, TOCOL(X),
        Values, UNIQUE(Xc),
        // calculate normalizing factor
        num, IF(proportion, COUNTA(Xc), 1),
        // count the unique values
        Counts, MAP(Values, LAMBDA(r, SUM(--(Xc = r)))) / num,
        // function returns table of two columns
        Output, HSTACK(Values, Counts),
        // sort by either 1st col (asc) or 2nd col (desc)
        IF(
            ascending,
            SORTBY(Output, Values,1),
            SORTBY(Output, Counts,-1)
        )
    )
);