Summary
Description
Summary returns a robust 5- or 7-number summary of numeric data as a column vector. By default it returns Tukey’s 5-number summary:
- the minimum
- the first quartile (ie the 25th percentile)
- the median (the 50th percentile)
- the third quartile (75th percentile)
- the maximum
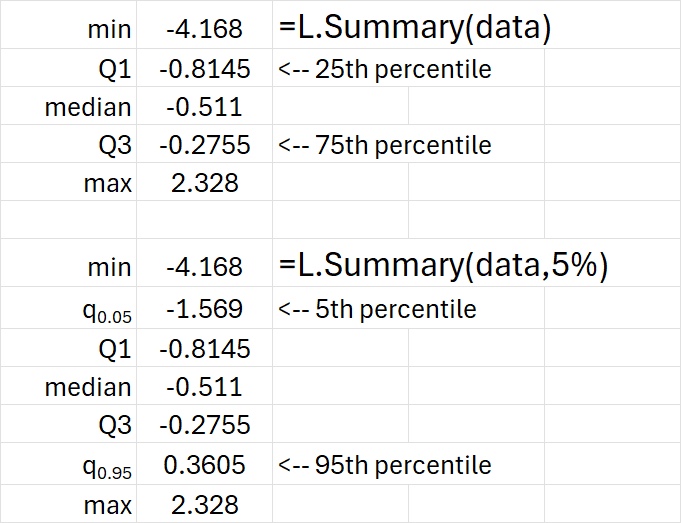
Tukey’s five-number summary is widely used in exploratory data analysis. Optionally Summary can return two other quantiles of the user’s choosing.
Syntax
Summary(data, [fraction]) where data is the input data (any shape) and fraction is the two-tailed probability of two additional quantiles to return. If no second argument is used then only five numbers are returned, as a column vector.
Example
An example of the usage is shown in the image below; download the Excel file to see the spreadsheet. Note that Excel’s inclusive quartiles/quantiles are used to obtain the values (see Source Code section).
Download: Summary.xlsx
Source Code
Summary = LAMBDA(
    X, // input data (any shape)
    [fraction], // 2-tailed probability of two additional quantiles to return
    LET(
        five_num, QUARTILE.INC(X, SEQUENCE(5, , 0)),
        IF(
            ISOMITTED(fraction),
            five_num,
            SORT(VSTACK(five_num, PERCENTILE.INC(X, VSTACK(fraction, 1 - fraction))))
        )
    )
);