rlnorm
Description
rlnorm returns a sample from the log-normal distribution. A log-normal distribution is one in which LN(X) is normally distributed. It occurs when there are a number of independent sources of variability whose errors are multiplicative. Log-normal distributions are used to describe a number of natural phenomena such as pollutant concentrations where the values are usually small and non-negative but with long tails.
Syntax
rlnorm([rows=1], [cols=1], [mean=0], [stdev=1], [seed_str]) where
rowsandcolsdescribe the shape of the outputmean() andstdev() are the parameters of the distribution. By default the function returns the standard lognormal distribution, whereLN(X)follows a standard normal distribution.seed_stris a memorable seed string. If omitted then a quasi-unique seed is used to generate a non-volatile output; see the documentation ofruniffor more detail about this. Use a memorable string of your choosing if you want to set an explicit seed for reproducibility purposes, and useGetSeedif you want a volatile output.
Note that the distribution parameters and do NOT describe the mean and standard deviation on the linear scale. Those are given below:
where and describe the mean and standard deviation on the linear scale.
Leaving the seed_str blank is fine for quick & dirty work but for simulation demos you will either want to set the seed with a memorable string or make the function volatile with GetSeed. Please read the caveats about choosing seed strings in the runif documentation; they apply to this function too.
Example
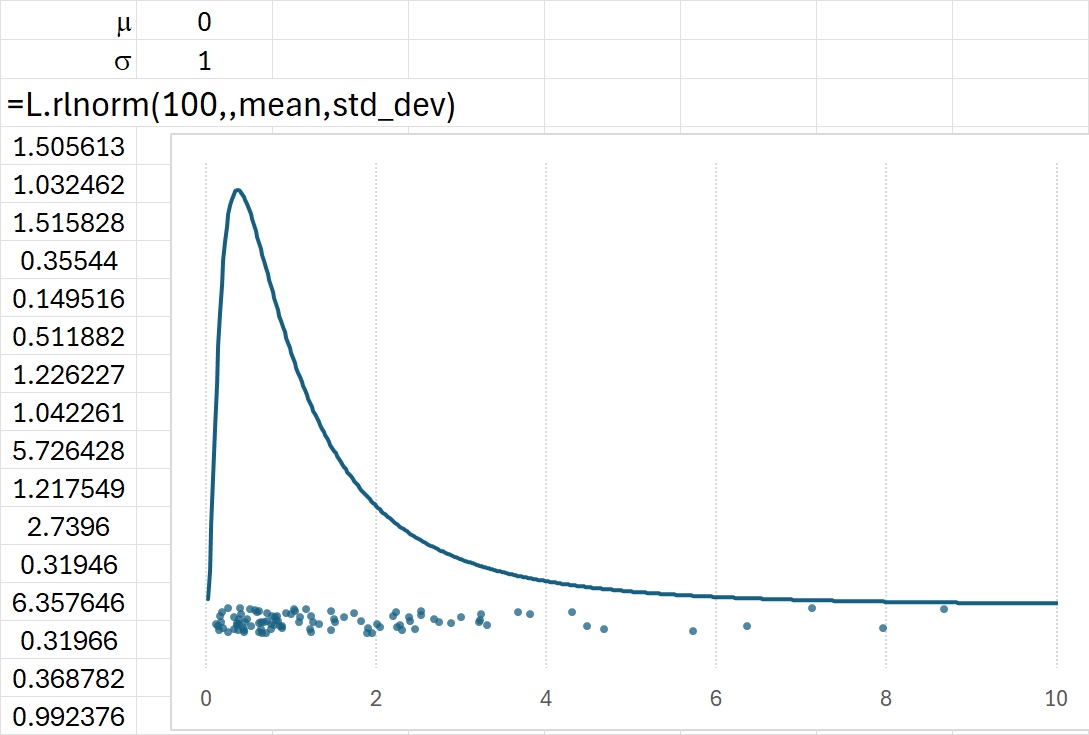
The example below compares the distribution of 100 draws from the standard log-normal distribution to the theoretical probability density function.
Download: rlnorm.xlsx
Source Code
rlnorm = LAMBDA(
    [rows], [cols],     // size of output
    [mean], [stdev],    // mean and std dev of log-transformed variable
    [seed_str],       // optional seed string (default uses this workbook's CLS_SystemSeed)
    LET(
        rows, IF(ISOMITTED(rows), 1, rows),
        cols, IF(ISOMITTED(cols), 1, cols),
        mean, IF(ISOMITTED(mean), 0, mean),
        stdev, IF(ISOMITTED(stdev), 1, stdev),
        seed_str, IF(
            ISOMITTED(seed_str),
            CLS_SystemSeed & ADDRESS(ROW(),COLUMN()) & "rlnorm",
            seed_str
            ),
        LOGNORM.INV(runif(rows, cols,,,,seed_str), mean, stdev)
    )
);