QQref
Description
QQ-plots often include a reference line; QQref supplies the two points for that line for the QQ plot data produced by the QQnorm function. The points returned by the QQref function should be added to the QQ plot of the data against the standard normal quantiles.
Syntax
QQref(data, [x_1 = -3], [x_2 = +3]) where
datais the univariate data in the QQ plotx_1andx_2are the X-coordinates for the ends of the reference line
By default the line extends between but you can supply other values if you wish the line to extend over a different range.
Example
The figure below shows the same QQ plot that was displayed in the QQnorm function description but with the reference line added. If the data points were normally distributed then they would be scattered around the reference line. But in this case there are clearly long tails on both sides of the distribution, particularly on the left side. Points far away from the line might be considered outliers.
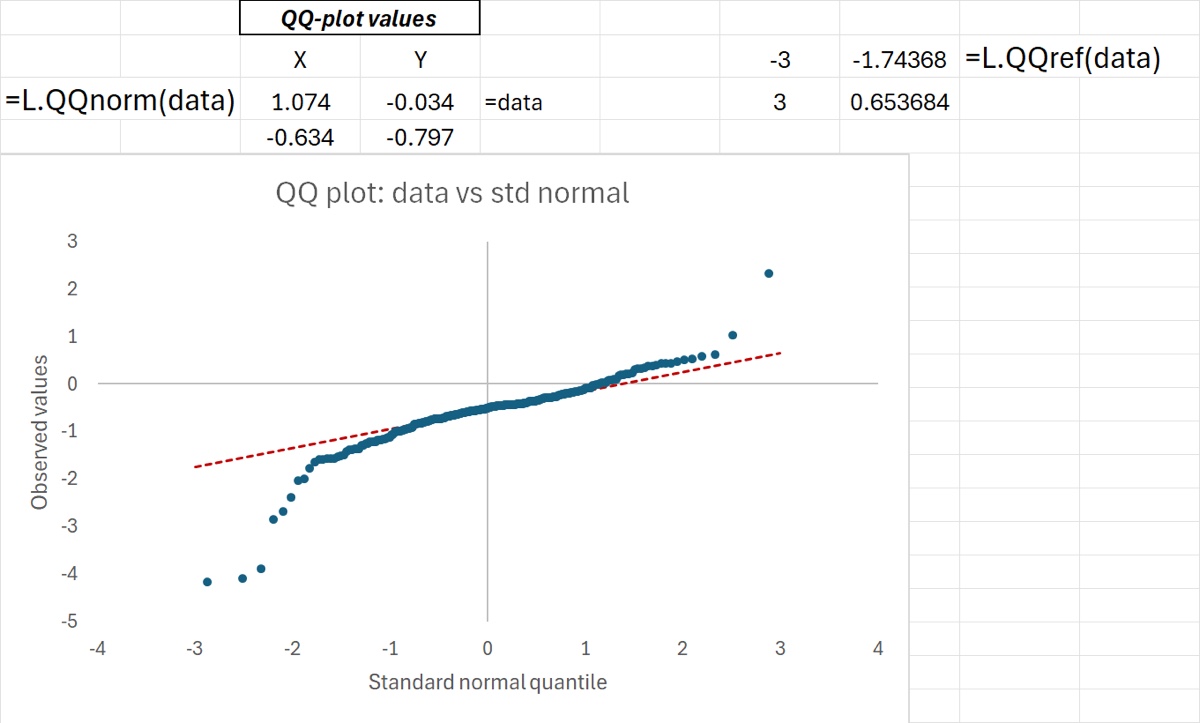
Download: QQref.xlsx
Source Code
QQref = LAMBDA(
    Y, // data in the QQ-normal plot
    [x_1], // 1st x-coordinate for the reference line (default -3)
    [x_2], // 2nd x-coordinate for the reference line (default +3)
    LET(
        x_1, IF(ISOMITTED(x_1), -3, x_1),
        x_2, IF(ISOMITTED(x_2), 3, x_2),
        // find the points that define the reference line
        Q1_x, NORM.S.INV(0.25),
        Q3_x, NORM.S.INV(0.75),
        Q1_y, QUARTILE.INC(Y, 1),
        Q3_y, QUARTILE.INC(Y, 3),
        // find slope and intercept of the line
        refSlope, (Q3_y - Q1_y) / (Q3_x - Q1_x),
        refInt, AVERAGE(Q1_y, Q3_y) - refSlope * AVERAGE(Q1_x, Q3_x),
        // calculate the y values to be plotted
        y_1, refSlope * x_1 + refInt,
        y_2, refSlope * x_2 + refInt,
        // output all four points as an array
        VSTACK(HSTACK(x_1, y_1), HSTACK(x_2, y_2))
    )
);