QQnorm
Description
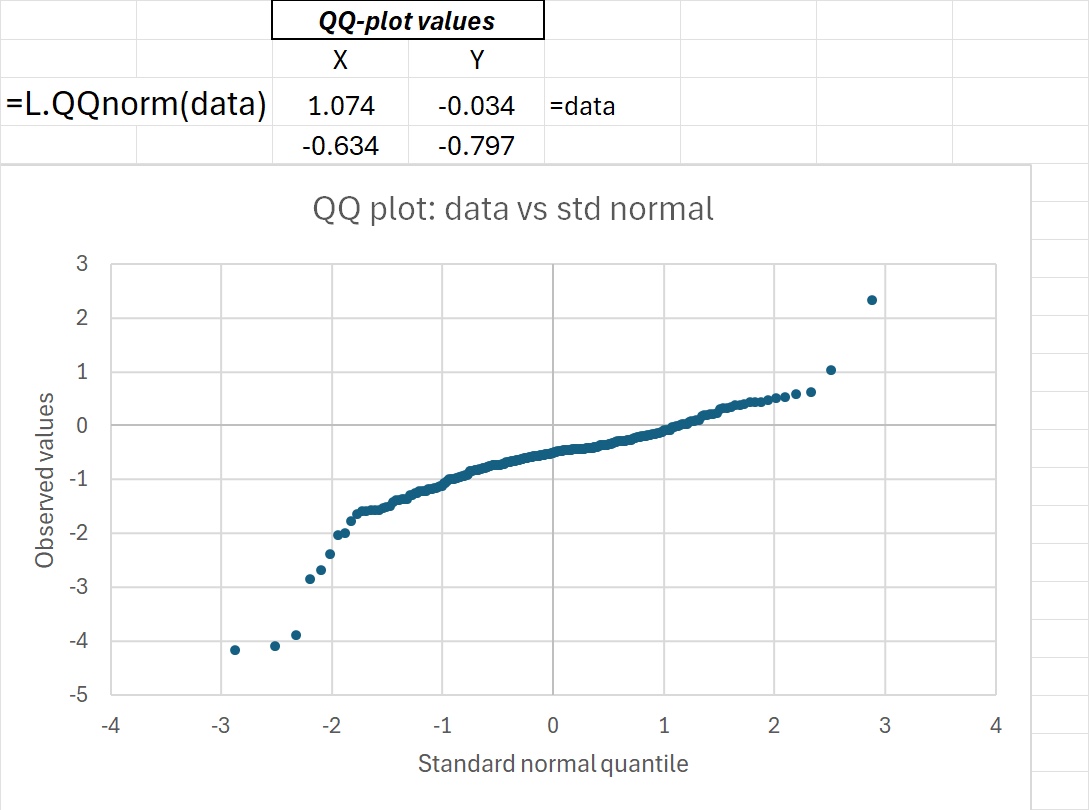
QQnorm returns the standard normal quantiles corresponding to the empirical cumulative distribution function (ECDF) of the input data. The function is used to construct QQ plots of a sample against the normal distribution; the function returns the X values for such a plot. Tied values are assigned the average rank of the tied group.
Syntax
QQnorm(data) where data is the input data (and will be the Y data for the QQ plot). The function returns the X data for that plot.
Example
The usage of the function to generate the X-axis of a QQ plot is shown below and in the Excel file.
Download: QQnorm.xlsx
Source Code
QQnorm = LAMBDA(
    Y, // data set to plot against std normal (as column vector)
    LET(
        // calc empirical cumulative distribution function, accounting for ties
        ECDF, (COUNTIF(Y, "<" & Y) + COUNTIF(Y, "<=" & Y)) / (2 * COUNT(Y)),
        // return corresponding std normal quantiles
        NORM.S.INV(ECDF)
    )
);