PolyConf
Description
PolyConf calculates confidence intervals associated with polynomial regression. It uses Excel’s LINEST to actually perform the regression calculations but first filters out non-numeric cells.
Syntax
PolyConf(Y, X, xu, [p=1], [S]) where
YandXare the dependent and independent variables, as row or column vectorsxuis the value at which to calculate the Y confidence intervalpis the polynomial order, defaulting to 1 (ie fitting a line to the X/Y data)Sis the vector of standard deviations of the values. If specified then weighted least-squares is used to calculate the confidence interval.
The function returns five values as a row vector:
- Predicted (fitted) value at
- The standard error of
- The 95% MOE for the true value . In other words, will contain the true value with 95% confidence.
- The lower limit of the 95% CI
- The upper limit of the 95% CI
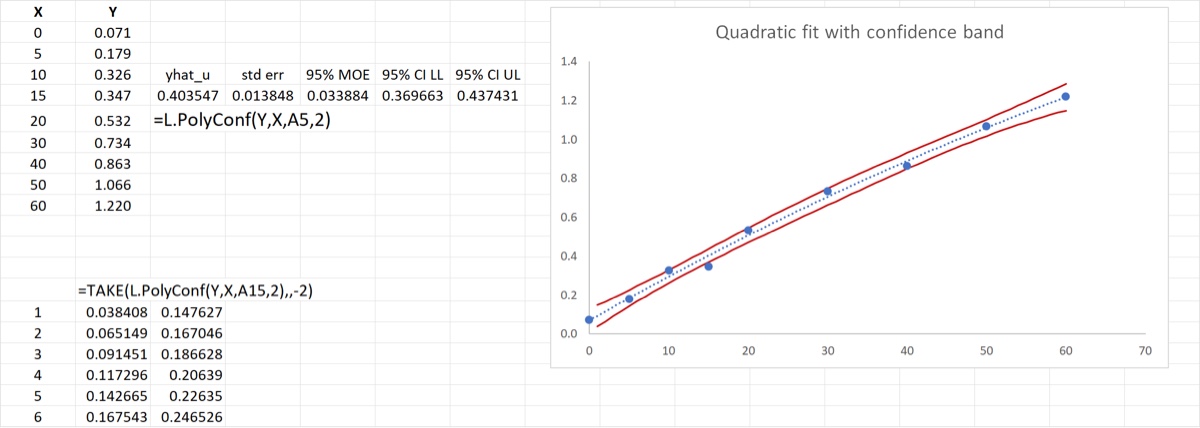
One can plot the last two values as a function of X to create a confidence band to a plot of the data, which contains the true values of (as a function of ) with 95% confidence. The example below will illustrate that use case.
Example
The X/Y data below is fitted with a quadratic line and PolyConf is used to calculate the confidence intervals at a given value of . The syntax returning all of the values is shown first while below the last two numbers (the CI boundaries) are calculated at a number of values of X in order to have a smooth confidence band. The TAKE function is used to only retain the last two values returned by PolyConf (ie, the CI boundaries).
Download: PolyConf.xlsx
Source Code
Helpers used: _PolyFit
PolyConf = LAMBDA(
    Y, // dependent values as row or column vector
    X, // independent values as row or column vector
    // X and Y must be same length but can contain non-numbers and empty cells
    xu, // value at which to predict y value
    [p], // optional polynomial order (default p=1)
    [S], // optional std devs of Y for weighted LS
    LET(
        p, IF(ISOMITTED(p), 1, p), // default value
        fit, IF(ISOMITTED(S), _PolyFit(Y, X, p, 1), _PolyFit(Y, X, p, S)),
        b, TAKE(fit, 1),
        inner, CHOOSEROWS(fit, SEQUENCE(p + 1, , 2)),
        sres, INDEX(fit, p + 3, 1),
        DOF, INDEX(fit, p + 3, 2),
        // predict y value (yhat) and its uncertainty
        // (need to avoid error when xu=0)
        X0, IF(xu <> 0, TRANSPOSE(xu ^ SEQUENCE(, p + 1, 0)), EXPAND(1, p + 1, 1, 0)),
        yhat, SUMPRODUCT(TRANSPOSE(b), X0),
        se_yhat, SQRT(MMULT(MMULT(TRANSPOSE(X0), inner), X0)) * sres,
        MOE, T.INV.2T(5%, DOF) * se_yhat,
        LL, yhat - MOE,
        UL, yhat + MOE,
        IF(ISTEXT(INDEX(fit, 1, 1)), INDEX(fit, 1, 1), HSTACK(yhat, se_yhat, MOE, LL, UL))
    )
);