OLS
Description
OLS is a convenient version of Excel’s LINEST for performing ordinary least-squares regression analysis. It has three main advantages over Excel’s function:
- it returns the correlation matrix of the regression coefficients (and a few other statistics not returned by
LINEST) - it labels the output for convenience
- it filters for numbers, removing rows in X and Y as needed. This allows the user, for example, to delete a value (eg an outlier) without throwing an error.
Syntax
OLS(Y, X) where Y is the response variable and X contains the explanatory variables (as columns).
This syntax is a little simpler than Excel’s version (which has two more arguments) at the cost of some flexibility. There is no option to exclude the intercept from the model nor an option to suppress the calculation of statistics (though of course one can truncate the output through the use of functions like TAKE, DROP, INDEX and the like).
The output of the function depends on how many X variables are in the input. The output is also labeled. The following statistics are included in the output:
- the regression model coefficients, including the intercept term, in the same order as the
LINESToutput - the standard errors of the coefficients
- the 95% margin of error (MOE), obtained as the product of the critical t-value and the standard error
- the standard deviation of the residuals
- the value
- the number of data points used in the fit (after removing rows with non-numbers) and the degrees of freedom of the residuals
- the ANOVA sum of squares values due to the regression model and the residuals
- the statistic and its p-value, describing the significance of the regression model
- the correlation matrix, with off-diagonal terms giving the correlation between the OLS coefficient estimates.
The latter is particularly important if one wishes to perform proper error propagation on any calculation involving two or more OLS estimates.
Example
The example below demonstrates the use of OLS to fit data to the Van Deemter equation. One application of this fit is to calculate the mobile phase flow velocity, , that results in the best separation efficiency. That calculation involves two of the regression coefficients and so calculating its standard error requires knowledge of the correlation of those coefficients, which OLS provides. (The actual error propagation calculation is left to the reader as an exercise.)
The Excel file is also included. Note that deleting any one of the values in the input data will not result in an error, unlike with LINEST.
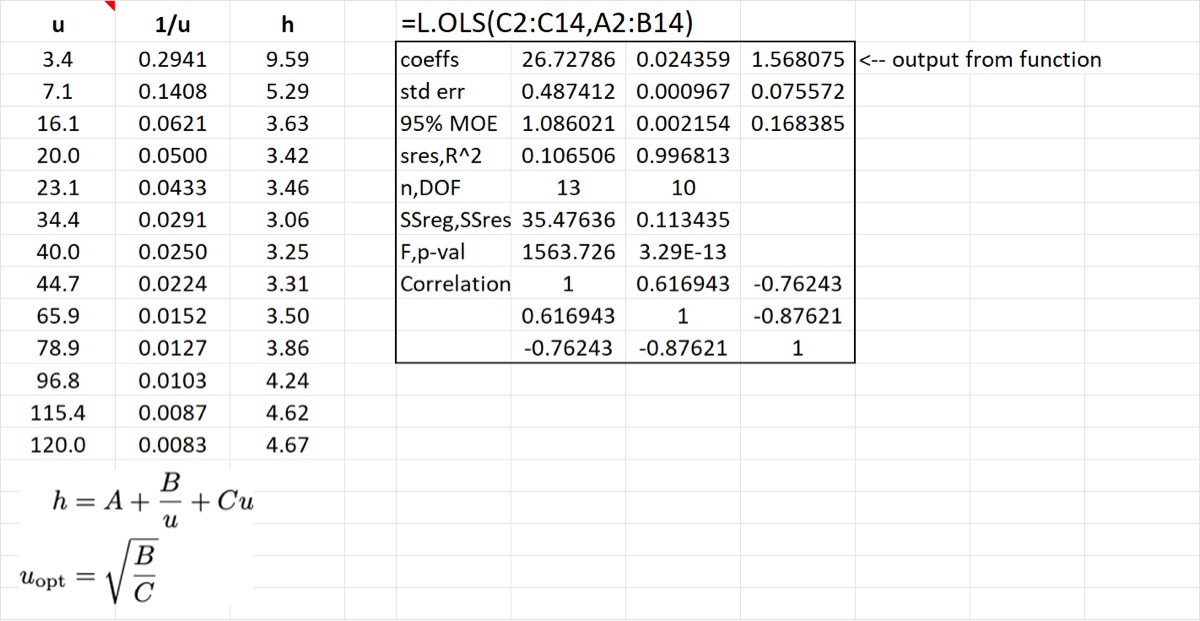
Download: OLS.xlsx
Source Code
OLS = LAMBDA(
    Y, // dependent values as a column vector
    X, // independent values, can be multiple columns (one per variable)
    LET(
        // get indices of valid rows for X and Y inputs
        Xind, BYROW(X, LAMBDA(X, PRODUCT(--ISNUMBER(X)))),
        Yind, ISNUMBER(Y),
        NumFilter, Xind * Yind,
        // only keep valid rows
        Xn, FILTER(X, NumFilter),
        Yn, FILTER(Y, NumFilter),
        m, LINEST(Yn, Xn, 1, 1),
        // get number of X variables
        p, COLUMNS(Xn),
        labels, {
            "coeffs";
            "std err";
            "95% MOE";
            "sres,R^2";
            "n,DOF";
            "SSreg,SSres";
            "F,p-val";
            "Correlation"
        },
        coeffs, CHOOSEROWS(m, 1),
        stderrs, CHOOSEROWS(m, 2),
        n, COUNT(Yn),
        DOF, INDEX(m, 4, 2),
        MOE, stderrs * T.INV.2T(5%, DOF),
        sres, INDEX(m, 3, 2),
        Rsqr, INDEX(m, 3, 1),
        SSrow, CHOOSEROWS(m, 5),
        Fobs, INDEX(m, 4, 1),
        pval, F.DIST.RT(Fobs, p, DOF),
        // Add correlation matrix to output
        // Create the X matrix. First reverse order of columns to match LINEST output
        T, IF(COLUMNS(Xn) > 1, INDEX(Xn, SEQUENCE(n), SEQUENCE(, p, p, -1)), Xn),
        // now add the ones vector in the last column
        Xm, HSTACK(T, Ones(n, 1)),
        Cov, MINVERSE(MMULT(TRANSPOSE(Xm), Xm)) * sres ^ 2,
        Dinv, MDiag(1 / CHOOSEROWS(m, 2)),
        Corr, MMULT(MMULT(Dinv, Cov), Dinv),
        // IFERROR used to avoid N/A values
        output, IFERROR(
            VSTACK(
                coeffs,
                stderrs,
                MOE,
                HSTACK(sres, Rsqr),
                HSTACK(n, DOF),
                SSrow,
                HSTACK(Fobs, pval),
                Corr
            ),
            ""
        ),
        IFERROR(HSTACK(labels, output), "")
    )
);