NLS
Description
NLS performs nonlinear least-squares regression using the Levenberg-Marquardt method. It does not use Excel’s SOLVER, so nothing needs to be installed or enabled, and it recalculates like any other formula when the data change.
The model is supplied as a lambda function of the X values and the parameters, along with starting values for the parameters. As with OLS and WLS, a row containing a non-number (in Y, X or S) is removed, and the fit can be weighted by the standard deviations of the Y values.
Syntax
NLS(Y, X, fn, p0, [S], [tol=1E-8], [maxiter=200]) where
Yis the response variable, as a column vectorXcontains the explanatory variable(s), as one or more columnsfnis the model: a lambda function of the formLAMBDA(x, p, formula)that returns the fitted values as a single column, one per data point. Herexis theXinput (with invalid rows removed) andpis the vector of parameters that must be extracted in theformula, which is what describes the regression model (more details below and in the example).p0contains the starting values of the parameters, as a row or a columnSis optional: the standard deviations of theYvalues, as a column vector. If given, the fit is weighted with weights ; only the relative sizes of the standard deviations matter for the coefficients and their standard errors.tolis the convergence tolerance (default )maxiteris the maximum number of iterations (default 200)
For example, to fit the lambda callback function would be
LAMBDA(x, p, INDEX(p, 1) * (1 - EXP(-INDEX(p, 2) * x)))The lambda function can be stored as a named function and used in the cell formula; indeed, naming the function is both a good way to test that it is working properly and to plot the fit alongside the data. For example, if the above function were stored as nl_fn then the cell formula might read as
=L.NLS(Y, X, nl_fn, p0)Note that the name nl_fn is supplied as an argument without parentheses.
With more than one X column, in the formula (ie the regression model) you must extract each variable, as in CHOOSECOLS(x, j).
The output has the same layout as WLS (and the Nonlinear Regression macro), with one extra row:
- the regression coefficients, in the order of
p0 - their standard errors
- the 95% margin of error (MOE), the product of the critical t-value and the standard error
- the standard deviation of the residuals and the value
- the number of data points and the degrees of freedom
- the sums of squares due to the regression and the residuals. is taken about the (weighted) mean of the fitted values, and .
- the statistic and its p-value, with and degrees of freedom for parameters (1 and for a single parameter)
iter, the number of iterations used- the correlation matrix of the coefficient estimates
An error message is returned instead if the inputs are invalid (for example a non-positive standard deviation, fewer data points than parameters, or a model that doesn’t return one value per data point), if the fit does not converge within maxiter iterations, or if the parameters can’t all be estimated (for example, one has no effect on the fitted values, or two are redundant). In that case try other starting values. As with SOLVER, a fit can converge to a local minimum rather than the best fit, so starting values matter: it is worth checking a fit by plotting it against the data, or by starting from different values.
Example
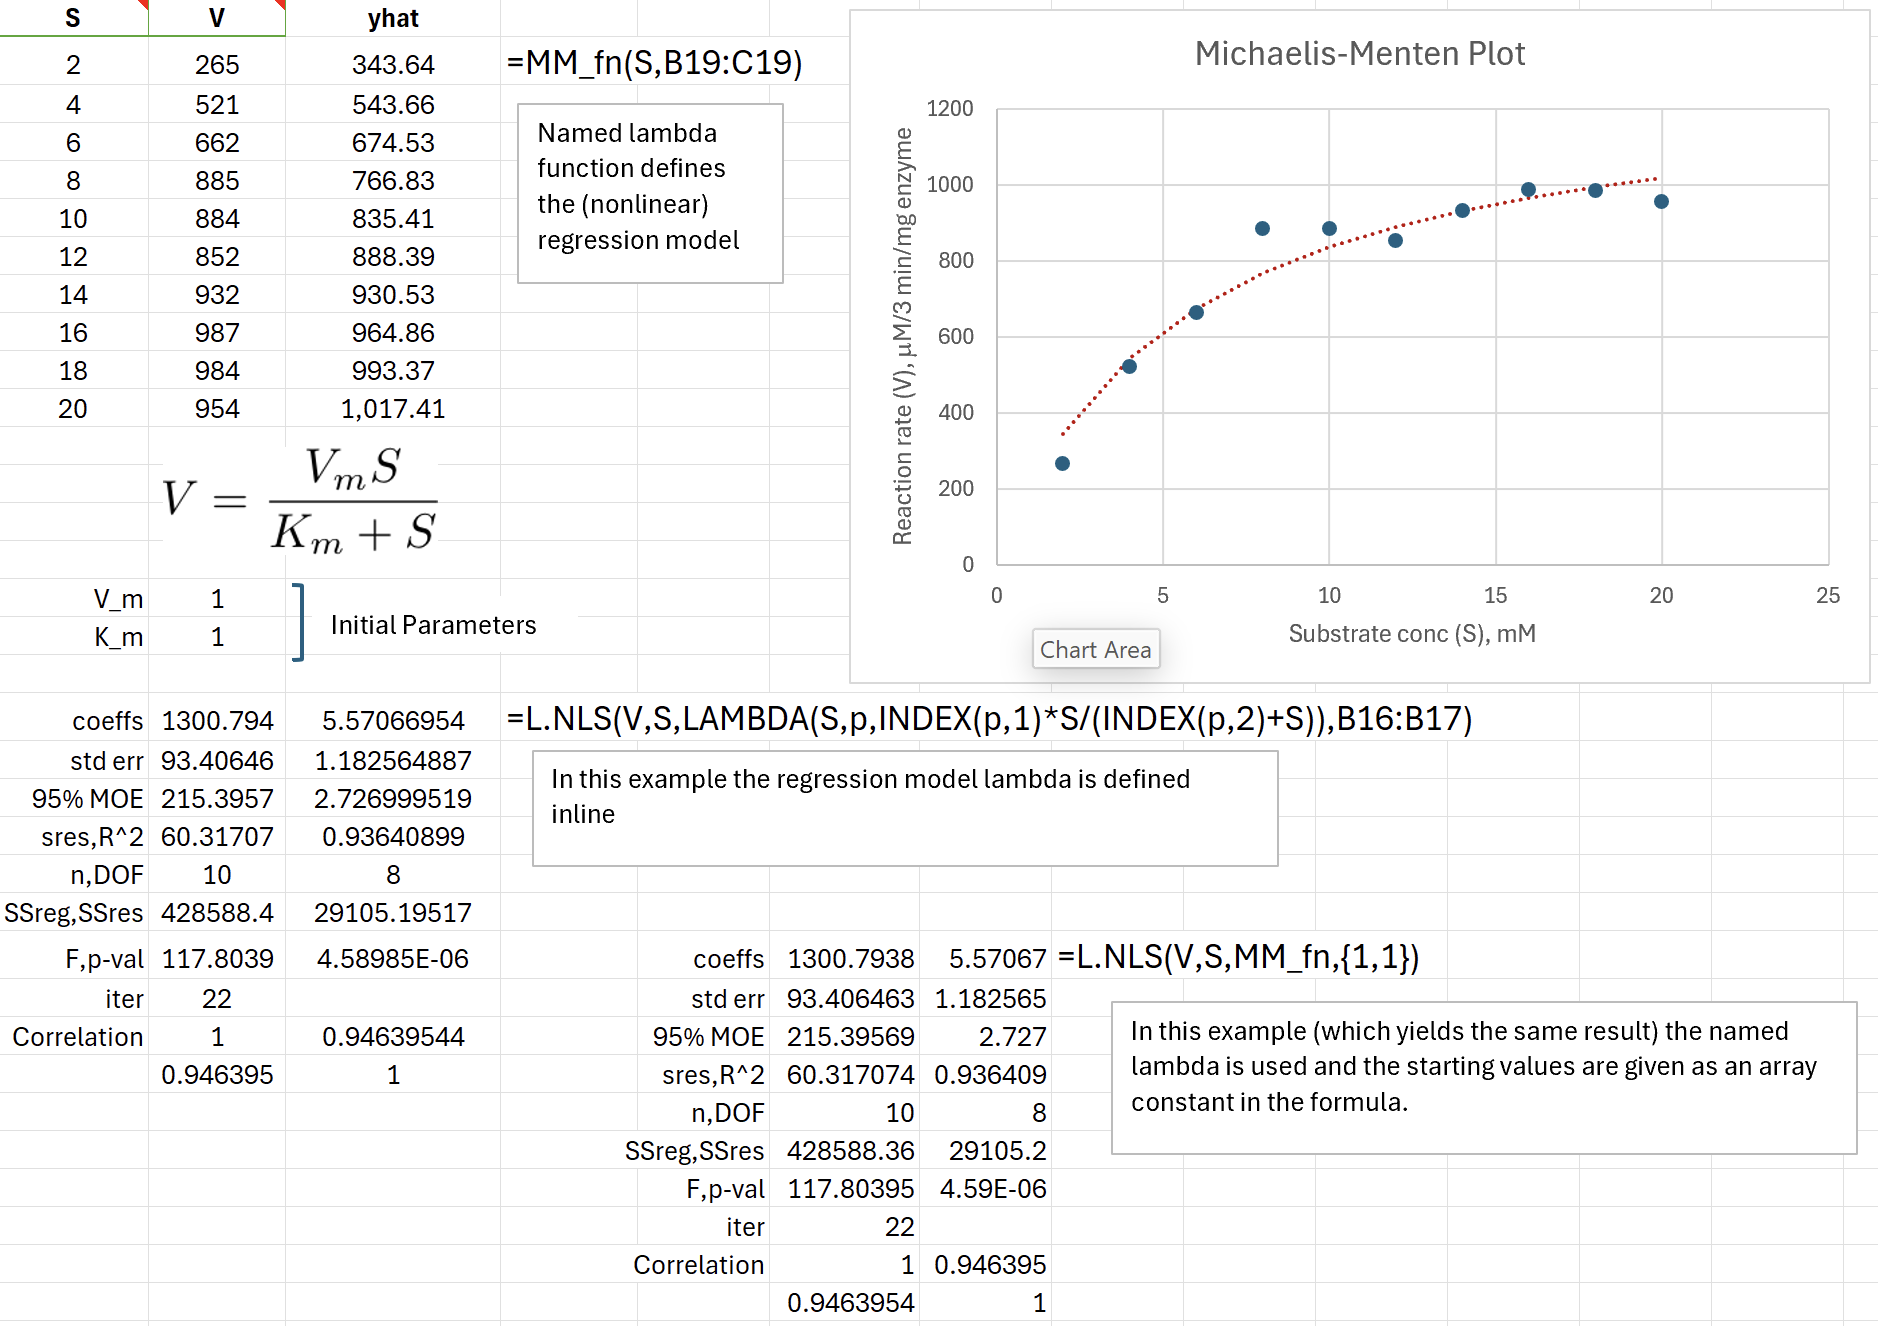
There are two examples of using NLS for nonlinear fitting. In the first example we fit data to the Michaelis-Menten equation, as shown in the image and in the first worksheet of the downloadable Excel file below. There are two calls to NLS shown in the image. One of them defines the lambda inline and references the range of cells containing the initial estimates of the parameters. The other call uses a defined name MM_fn for the same LAMBDA function. That function is also used to calculate the yhat values that were added to the plot.
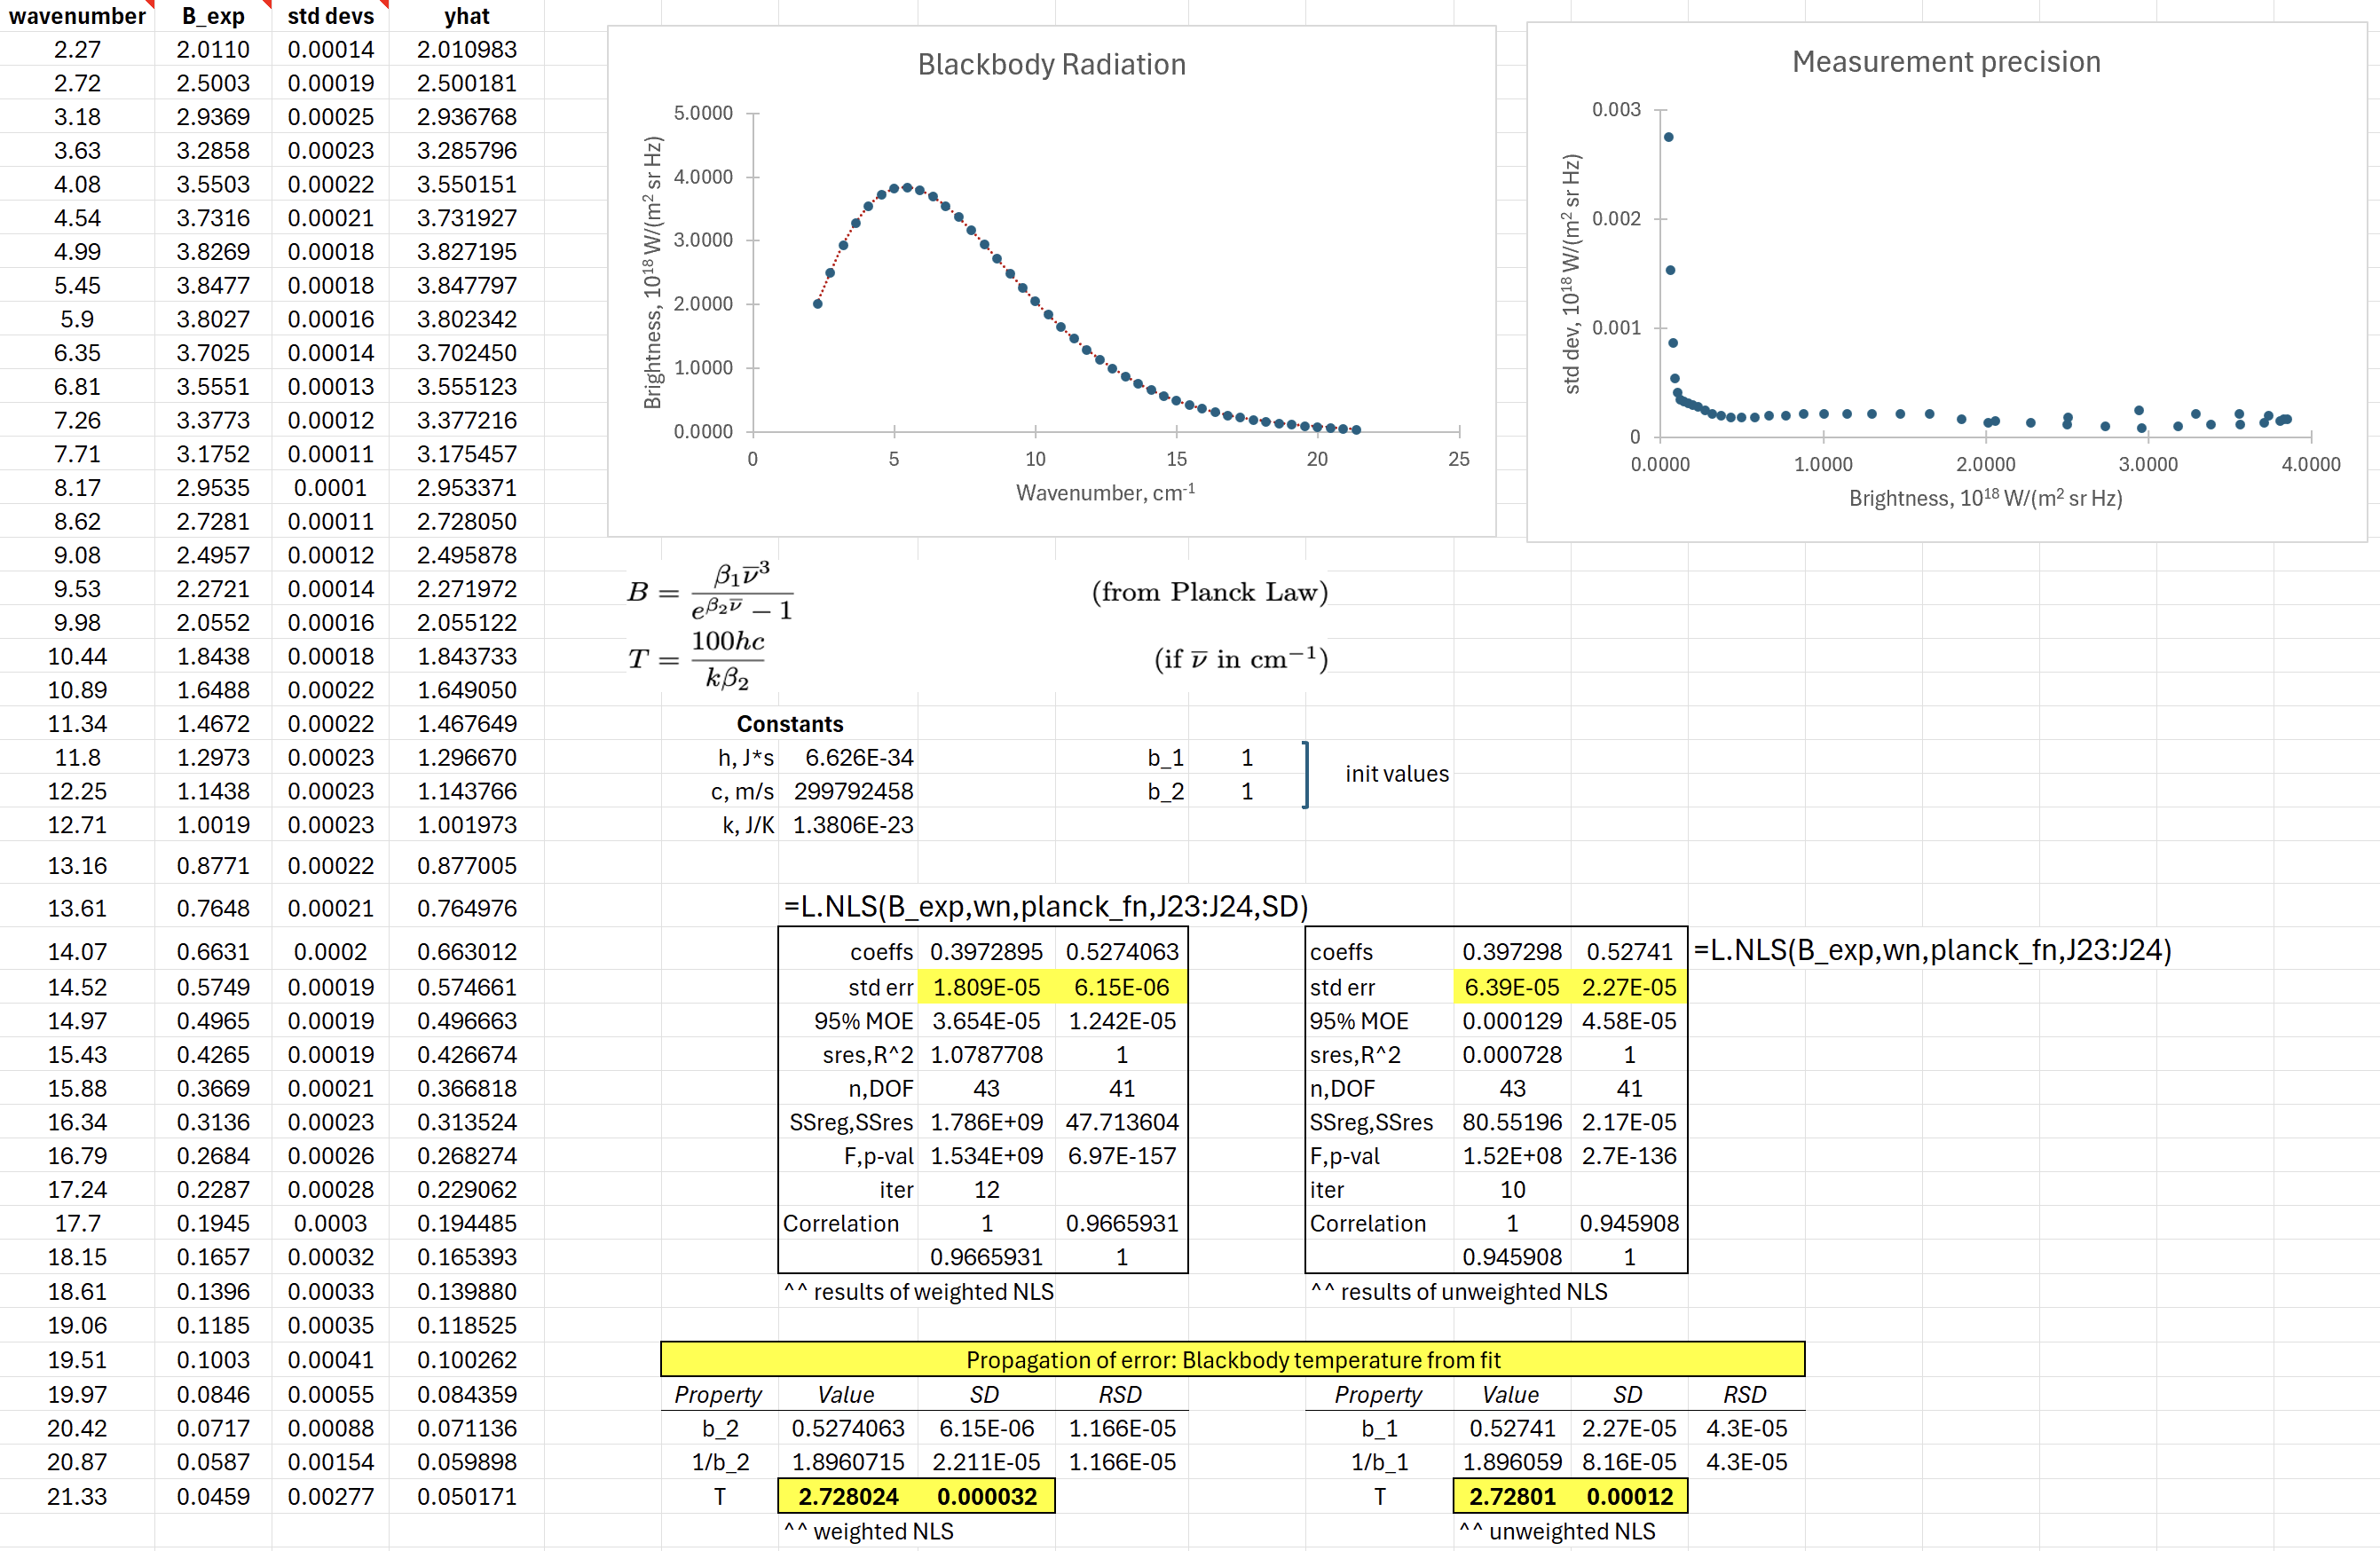
The next example is on the second worksheet and illustrates the use of weighted nonlinear LS to fit data to a blackbody radiator. Nonlinear LS regression is needed in order to fit the data to Planck’s Law; weighted LS regression is required to obtain the proper standard errors for use in error propagation.
Download: NonlinearRegression.xlsx
Source Code
NLS = LAMBDA(
    Y, // dependent values as a column vector
    X, // independent values, can be multiple columns
    fn, // LAMBDA(x, p) returning the fitted values as a column
    p0, // starting values of the parameters, row or column
    [S], // optional std devs of the Y values, as a column vector
    [tol], // convergence tolerance (default 1E-8)
    [maxiter], // maximum number of iterations (default 200)
    LET(
        tol, IF(ISOMITTED(tol), 10 ^ -8, tol),
        maxiter, IF(ISOMITTED(maxiter), 200, maxiter),
        S, IF(ISOMITTED(S), 1 + 0 * Y, S),
        // get indices of valid rows for X, Y and S inputs
        Xind, BYROW(X, LAMBDA(X, PRODUCT(--ISNUMBER(X)))),
        NumFilter, Xind * ISNUMBER(Y) * ISNUMBER(S),
        // only keep valid rows
        Xn, FILTER(X, NumFilter),
        Yn, FILTER(Y, NumFilter),
        Sn, FILTER(S, NumFilter),
        n, ROWS(Yn),
        pstart, TOCOL(p0),
        k, ROWS(pstart),
        sw, 1 / Sn,
        wt, sw ^ 2,
        // fn as a function of a parameter column, weighted; #N/A if it
        // errors or doesn't return an n x 1 column
        isRow, COLUMNS(p0) > 1,
        fw, LAMBDA(pc,
            LET(
                v, fn(Xn, IF(isRow, TOROW(pc), pc)),
                IF(IFERROR(AND(ROWS(v) = n, COLUMNS(v) = 1, ISNUMBER(SUM(v))), FALSE), sw * v, NA())
            )
        ),
        fit, _LMFit(fw, pstart, sw * Yn, tol, maxiter),
        p, TAKE(fit, k),
        SSres, INDEX(fit, k + 2),
        // covariance at the estimates, from the column-scaled J'WJ
        J, _NumJac(fw, p),
        Dg, TOCOL(BYCOL(J ^ 2, LAMBDA(c_, SUM(c_)))),
        D, IF(Dg > 0, SQRT(Dg), 1),
        AsInv, MINVERSE(MMULT(TRANSPOSE(J), J) / MMULT(D, TRANSPOSE(D))),
        // variance inflation factors; a redundant parameter gives ~1E15
        vif, INDEX(AsInv, SEQUENCE(k), SEQUENCE(k)),
        singular, IFERROR(OR(MAX(vif) > 10 ^ 12, MIN(vif) <= 0), TRUE),
        DOF, n - k,
        sres, SQRT(SSres / DOF),
        Cov, AsInv / MMULT(D, TRANSPOSE(D)) * sres ^ 2,
        stderrs, TOROW(SQRT(INDEX(Cov, SEQUENCE(k), SEQUENCE(k)))),
        MOE, stderrs * T.INV.2T(5%, DOF),
        yhat, fw(p) / sw,
        SSreg, IF(k > 1, SUM(wt * (yhat - SUM(wt * yhat) / SUM(wt)) ^ 2), SUM(wt * yhat ^ 2)),
        df_num, IF(k > 1, k - 1, 1),
        Rsqr, SSreg / (SSreg + SSres),
        Fobs, SSreg / df_num / sres ^ 2,
        pval, F.DIST.RT(Fobs, df_num, DOF),
        Corr, Cov / MMULT(TOCOL(stderrs), stderrs),
        labels, {
            "coeffs";
            "std err";
            "95% MOE";
            "sres,R^2";
            "n,DOF";
            "SSreg,SSres";
            "F,p-val";
            "iter";
            "Correlation"
        },
        output, IFERROR(
            VSTACK(
                TOROW(p),
                stderrs,
                MOE,
                HSTACK(sres, Rsqr),
                HSTACK(n, DOF),
                HSTACK(SSreg, SSres),
                HSTACK(Fobs, pval),
                INDEX(fit, k + 4),
                Corr
            ),
            ""
        ),
        IF(
            OR(Sn <= 0),
            "ERROR: std devs must be positive",
            IF(
                n <= k,
                "ERROR: need more data points than parameters",
                IF(
                    NOT(ISNUMBER(SUM(fw(pstart)))),
                    "ERROR: fn must return a single column of numbers, one per data point, at p0",
                    IF(
                        OR(INDEX(fit, k + 5) = 1, NOT(ISNUMBER(SUM(J)))),
                        "ERROR: fn failed near the current estimates; try other starting values",
                        IF(
                            AND(INDEX(fit, k + 3) <> 1),
                            "ERROR: did not converge in " & maxiter & " iterations; try other starting values or a larger maxiter",
                            IF(
                                singular,
                                "ERROR: the parameters can't all be estimated (one has no effect, or two are redundant); try other starting values",
                                IFERROR(HSTACK(labels, output), "")
                            )
                        )
                    )
                )
            )
        )
    )
);