LINEST
Description
Excel’s LINEST is a workhorse function for linear regression; in fact it is a dependency for a number of CLS-Stats regression functions. But it cannot handle missing values so it can be difficult to use when you want to see the effects of removing certain values (eg, outliers) on regression analysis.
The CLS-Stats LINEST is a drop-in replacement for Excel’s function but it handles missing values elegantly. You can use it by simply adding the prefix of the CLS-Stats lambda functions into any cell formula that uses LINEST.
Note that if you do not use a prefix for the CLS-Stats function then Excel’s function will take precedence and be used instead of the lambda function.
Syntax
The syntax is identical to that of Excel’s function: LINEST(Y, X, [intcpt=TRUE], [stats=FALSE]) where
Yis the response variable (a column vector) andXcontains the independent variables as column vectorsintcptis a boolean on whether to include an intercept term in the regression model (default isTRUEso that the intercept is included)statsis a boolean that controls whether to output additional statistics (default isFALSE)
The output of the CLS-Stats version is identical to Excel’s function; indeed, after filtering out missing values, Excel’s version of the function is called directly. Please see Excel’s help files for more information.
Example
Below is an example of some fake regression data that is plotted; both Excel’s LINEST and the lambda function return the same output, as expected.
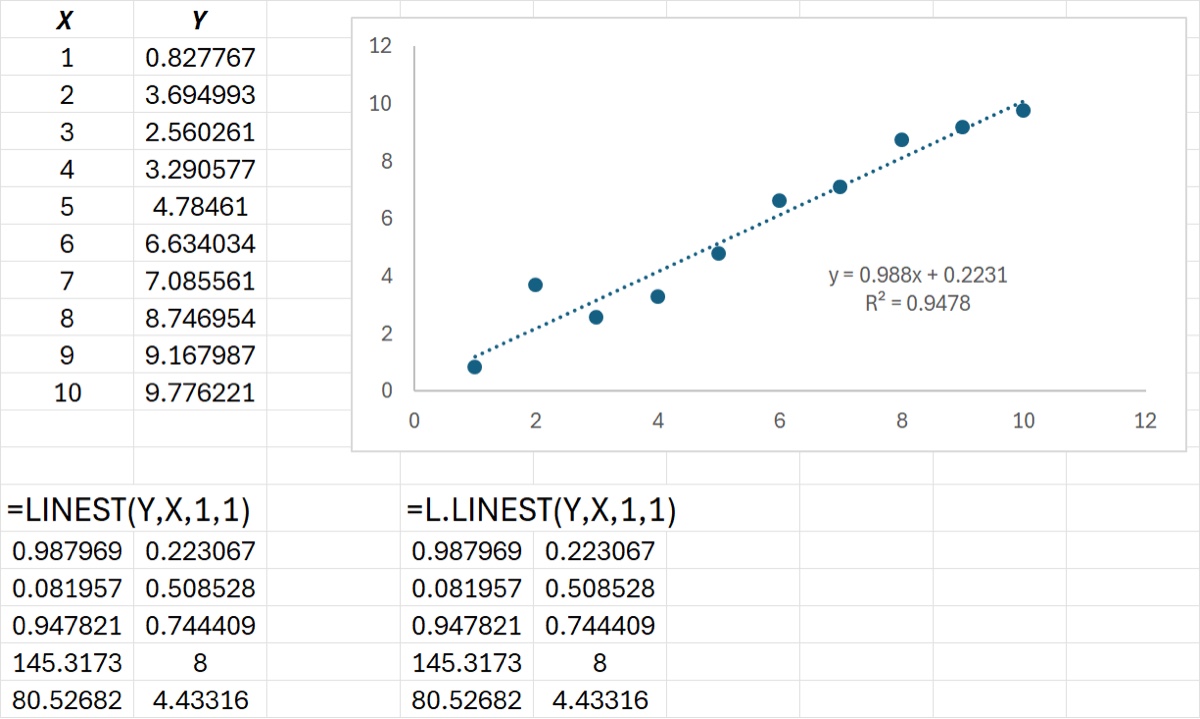
The second point looks like it might be an outlier; what would the fit be like without it? This kind of “what if” question is a spreadsheet’s bread and butter: they (usually) recalculate the outputs of any cell formula whose inputs have changed. But as you can see below, Excel’s LINEST throws an error instead; strangely, even the trendline fit in the plot responds more gracefully, as does the lambda function.
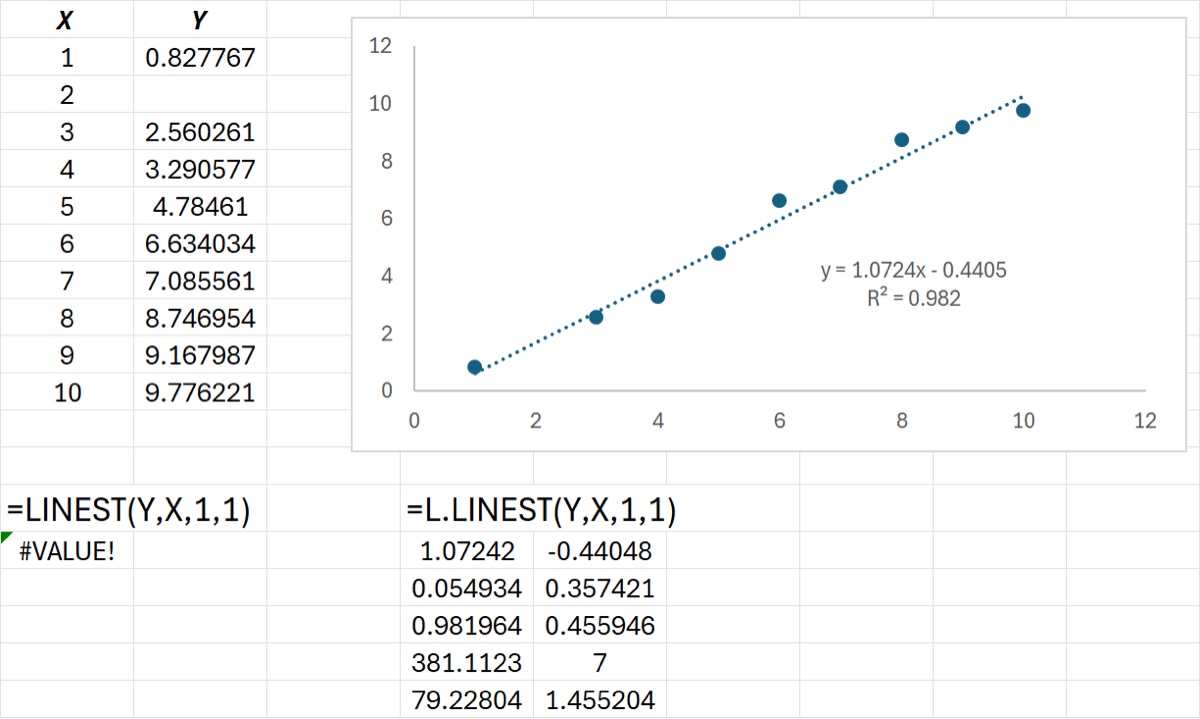
Note that the X input can contain multiple columns for different explanatory variables. Deleting any value in a given row will remove that row from the regression calculation (as well as the corresponding Y row); deleting a Y value will also remove the corresponding X row.
Play around with the spreadsheet below to get a sense for how the CLS-Stats and Excel versions of LINEST behave.
Download: LINEST.xlsx
Source Code
LINEST = LAMBDA(
    Y, // dependent values as a row or column vector
    X, // independent values (multiple variables possible)
    [intcpt], // passed to Excel's LINEST
    [stats], // passed to Excel's LINEST
    LET(
        intcpt, IF(ISOMITTED(intcpt), TRUE, intcpt),
        stats, IF(ISOMITTED(stats), FALSE, stats),
        // ensure variables are columns
        Yc, IF(COLUMNS(Y) = 1, Y, TRANSPOSE(Y)),
        Xc, IF(COLUMNS(Y) = 1, X, TRANSPOSE(X)),
        // get indices of valid rows (containing only numbers in all entries)
        Xind, BYROW(Xc, LAMBDA(Xc, PRODUCT(--ISNUMBER(Xc)))),
        Yind, ISNUMBER(Yc),
        numbers, Xind * Yind,
        // only pass rows with all numbers to LINEST
        Xn, FILTER(Xc, numbers),
        Yn, FILTER(Yc, numbers),
        LINEST(Yn, Xn, intcpt, stats)
    )
);