Hist
Description
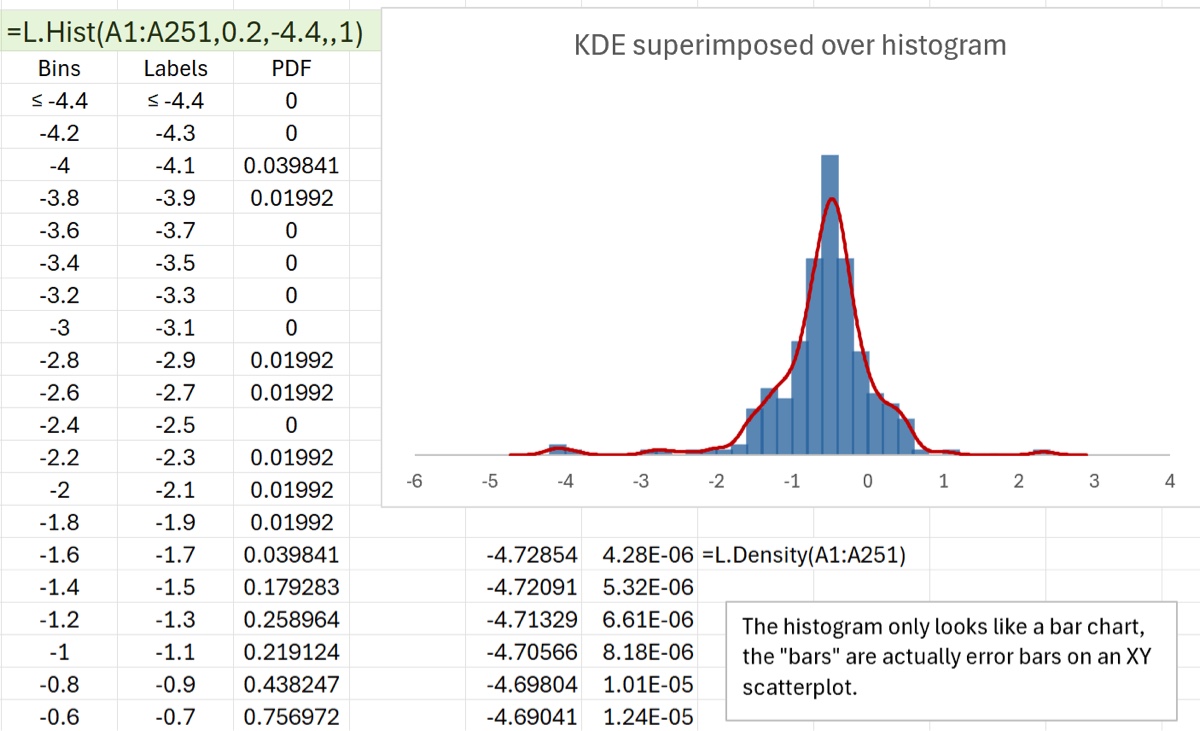
The Hist function returns binned frequency or probability density values. The default bin width uses the Freedman-Diaconis rule. The values are suitable for plotting on an XY scatterplot, making it easier to combine with other data than Excel’s native histogram plot. An example of this (with the KDE superimposed over the histogram values) is shown in the Example section.
Syntax
Hist(data, [h], [start], [end], [density=false]) where
datais the univariate data to be binned (any shape)his the bin width; if omitted it defaults to the Freedman-Diaconis valuestartandendare the starting and ending values for the binsdensityis a boolean (default false) on whether to return counts or a probability density
The function returns three columns (with column labels):
- the first column contains the values used in calling Excel’s
FREQUENCYfunction to count the number of data points in each bin - the second column is midway between bin boundaries and is suitable for some plotting applications
- the last column is either a count or a probability density
Example
The screenshot below shows how it is called; the default values are overridden to give nice bin boundaries but that doesn’t really matter (the bin width is near the Freedman-Diaconis value). Histograms are usually presented as bar charts but those are difficult to combine with XY numeric data such as a KDE plot. In the figure below, the bars are a bit of a kludge: they are actually error bars in one direction with a width chosen to give the appearance of a boundary between bars. Examine the XL file (below) for more information on how it was created.
Download: Hist.xlsx
Source Code
Hist = LAMBDA(
    X,          // input data (any shape)
    [h],        // bin width
    [start],    // first bin
    [end],      // the last bin
    [density],  // boolean whether to return probability densities
    LET(
        Xc, TOCOL(X),
        N, COUNT(Xc),
        IQR, QUARTILE.INC(Xc,3) - QUARTILE.INC(Xc,1),
        // Freedman-Diaconis default width
        h, IF(
            ISOMITTED(h),
            2 * IQR / N^(1/3),
            h
        ),
        // don't want to start right at min value
        start, IF(ISOMITTED(start), min(Xc)-h, start),
        // end is approx since it depends on h as well
        end, IF(ISOMITTED(end), MAX(Xc), end),
        // user chooses whether to calc prob density (default no)
        density, IF(ISOMITTED(density), FALSE, density),
        steps, (end - start) / h,
        // set up bins and then call FREQUENCY
        bins, SEQUENCE(CEILING.MATH(steps + 1),,start,h),
        counts, FREQUENCY(Xc,bins),
        output, IF(
            density,
            counts/(N * h), //probability density
            counts
        ),
        labels, VSTACK("less", bins + h/2, "more"),
        HSTACK(
            VSTACK("Bins", "≤ " & TAKE(bins, 1), DROP(bins, 1), "> " & TAKE(bins, -1)),
            VSTACK("Labels", "≤ " & TAKE(bins, 1), DROP(bins - h / 2, 1), "> " & TAKE(bins, -1)),
            VSTACK(IF(density, "PDF", "Count"), output)
        )
    )
);