ECDF
Description
The empirical cumulative distribution function is a discrete function calculated from the probability that a given value in a sample is greater than or equal to the other values in the data set. The function is used to construct QQ plots.
Syntax
ECDF(X) where X is the input data, in any shape. The output of ECDF is the same size and shape as the input.
Example
The ECDF function can be used to compare the distribution of a data set to any theoretical distribution. In the example below it is used to compare bootstrapped variance ratios to the theoretical F distribution. The bootstrapped version of the F-test yielded much different results from the parametric test, so a QQ plot against the F distribution was constructed for the bootstrapped variance ratios, and the results are shown. The ECDF function was used to construct that QQ plot. (Both QQ and KDE plots show the extreme positive skew of the variance ratio sampling distribution, consistent with the large outliers present in the data set.)
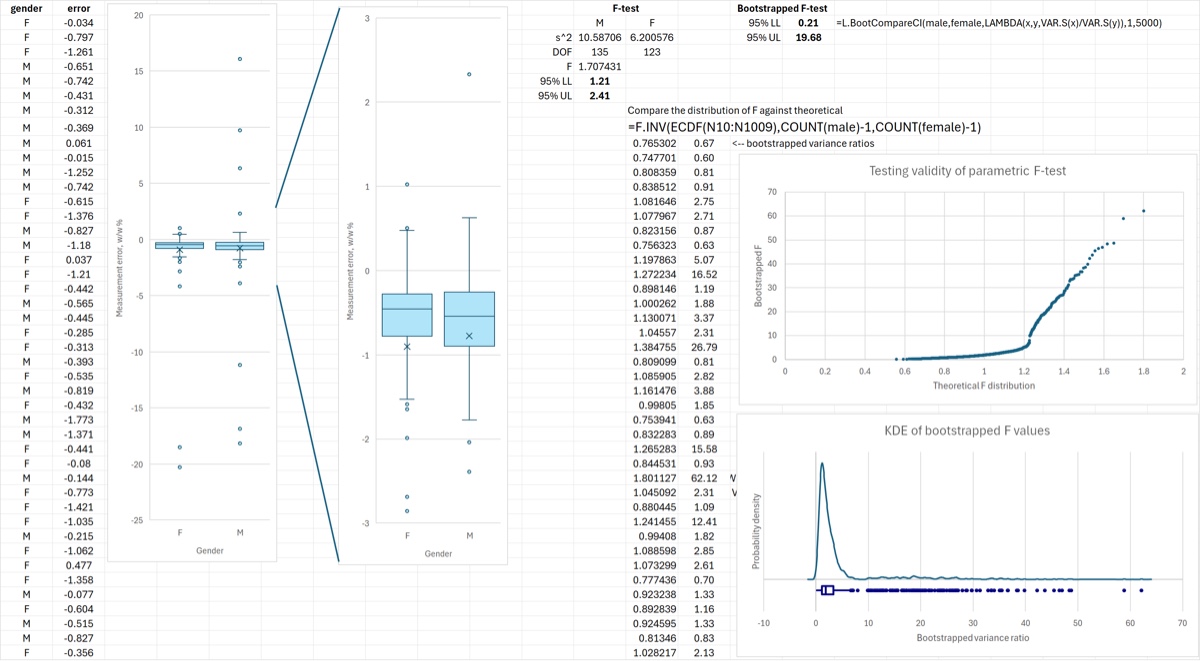
Note that the volatile bootstrap functions were changed to their output values for the figure below, to make the spreadsheet more responsive.
Download: ECDF.xlsx
Source Code
This is a one-liner. It accounts for ties and, in the absence of ties, simplifies to the standard formula used in calculating ECDF.
ECDF = LAMBDA(
    X, // input data (any shape)
    (COUNTIF(X, "<" & X) + COUNTIF(X, "<=" & X)) / (2 * COUNT(X))
);