BoxWhiskers
Description
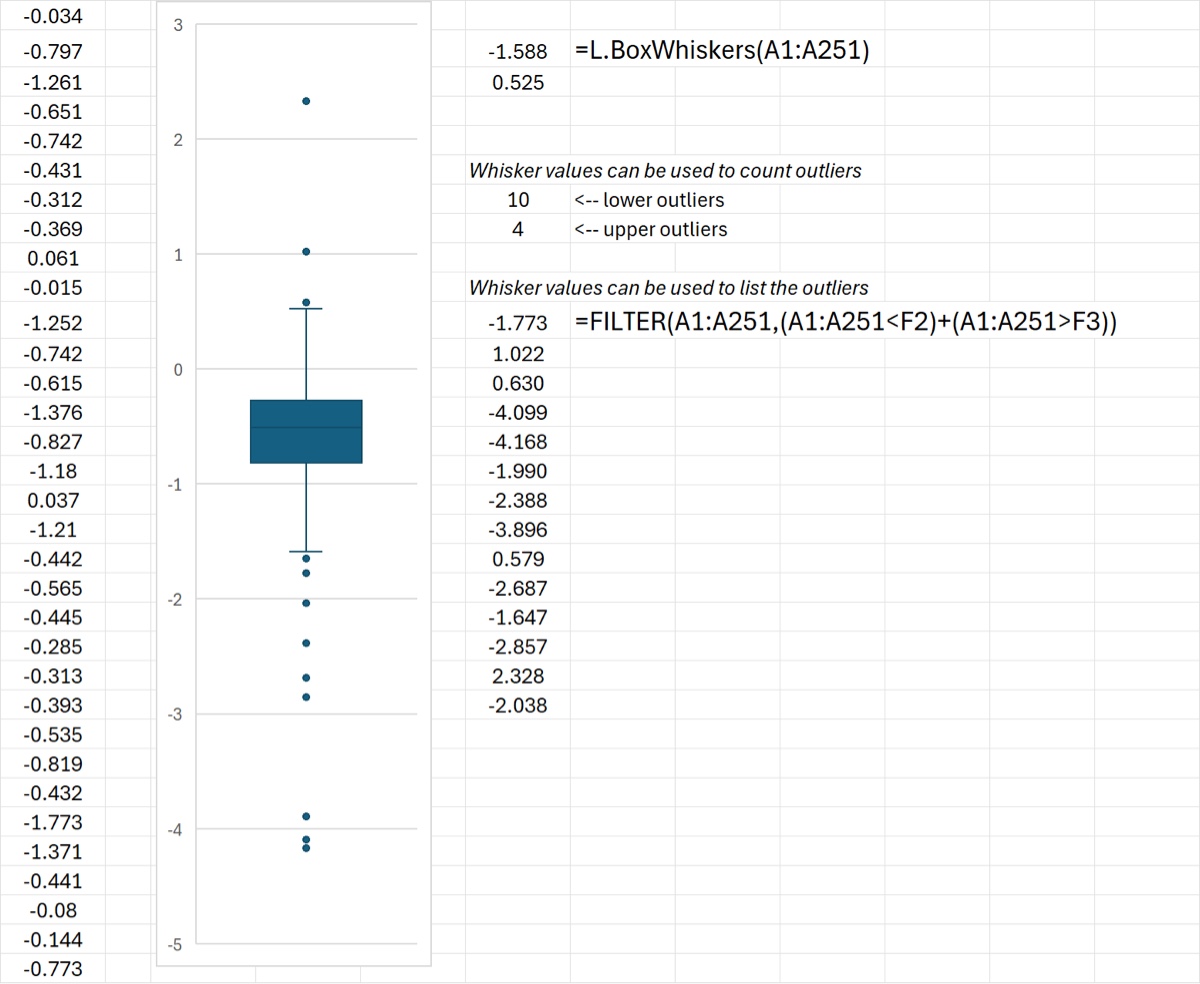
BoxWhiskers returns the lower and upper whiskers of boxplots using the criterion and “inclusive” quartiles. The values are returned as a column vector. Note that the whiskers always end on values contained in the data. One use of these is to count or list outliers, so you want to look for values less than (not less than or equal to) the smaller whisker value plus values greater than (not greater than or equal to) the larger whisker value.
Syntax
BoxWhiskers(X)
- where
Xis the input data (can be column or row vector or a table)
Output is a 2-element column vector with the lower and upper whisker values.
Example
The screenshot below shows how the function can be used for data that are in cells A1:A251 in the spreadsheet. The values returned correspond to the whiskers in the boxplot and are two values in the dataset.
The XL workbook below contains the full example.
Download: BoxWhiskers.xlsx
Source Code
BoxWhiskers = LAMBDA(
    data,   // any shape
    LET(
        // convert to sorted column of data
        Xc, TOCOL(data),
        // calc upper and lower fences using inclusive quartiles
        Q_1, QUARTILE.INC(Xc,1),
        Q_3, QUARTILE.INC(Xc,3),
        IQR, Q_3 - Q_1,
        lowerFence, Q_1 - 1.5 * IQR,
        upperFence, Q_3 + 1.5 * IQR,
        // find closest points within fences
        innerData, FILTER(
            Xc,
            (Xc > lowerFence) * (Xc < upperFence)
        ),
        lower, MIN(innerData),
        upper, MAX(innerData),
        // return as column
        VSTACK(lower, upper)
    )
);