BoxplotXY
Description
BoxplotXY returns 14 pairs of coordinates for plotting a horizontal boxplot using an XY scatterplot, with lines connecting the points. At this point Excel does not have a native way to do this, though it is possible with a call to Python. At some point I imagine this function will become obsolete. It only works for univariate data, unlike Excel’s native function that can be used to compare the boxplots by a grouping variable.
Note that this function will not plot the outliers; those must be obtained and added to the plot. An example of doing this is shown in the Example section below.
Syntax
BoxplotXY(data, [fullrange=FALSE], [offset=0], [halfwidth=1])
datais the input datafullrangeis a boolean that determines whether the whiskers should extend all the way to the min/max of the data. The default (FALSE) is that the whiskers end on a data point within of the upper and lower sides of the box.offsetis the offset for the valueshalfwidthcontrols the box width
The output of the function is two column vectors of 14 elements each, the first of which is the values and the second being the values.
Example
Below is a screenshot of the function in action, showing how it can be used to create a horizontal boxplot with outliers. Default values are used for inputs and BoxWhiskers is used to obtain the outliers that were added to the plot separately.
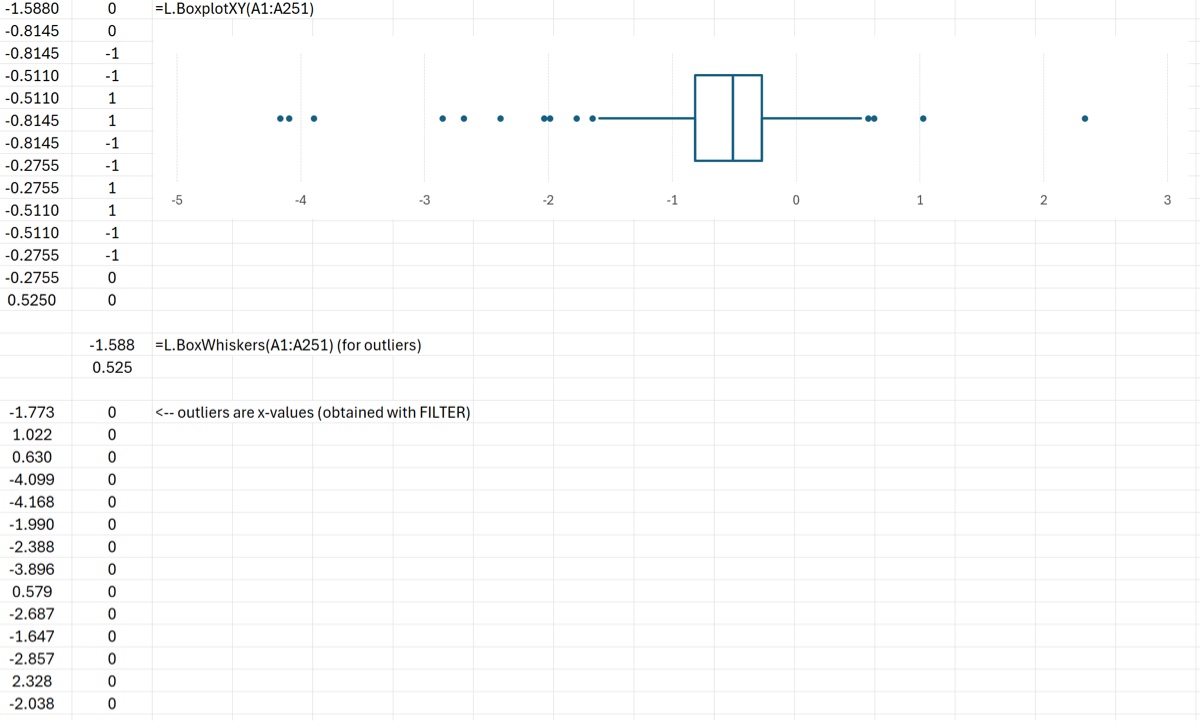
The XL file below shows the use of the function to create the plot in the image.
Download: HorizontalBoxplot.xlsx
Source Code
BoxplotXY = LAMBDA(
    data,           // univariate data (any shape)
    [fullrange],    // should whiskers extend to min/max values?
    [offset],       // y-position of box center
    [halfwidth],    // half the width of the box
    LET(
        // set default values of optional inputs
        fullrange, IF(ISOMITTED(fullrange), FALSE, fullrange),
        offset, IF(ISOMITTED(offset), 0, offset),
        halfwidth, IF(ISOMITTED(halfwidth), 1, halfwidth),
        // get whisker values
        whiskers, IF(
            fullrange,
            VSTACK(MIN(data), MAX(data)),
            BoxWhiskers(data)
        ),
        lowerWhisker, INDEX(whiskers,1),
        upperWhisker, INDEX(whiskers, 2),
        // need the quartiles
        Q1_, QUARTILE.INC(data,1),
        Q2_, MEDIAN(data),
        Q3_, QUARTILE.INC(data,3),
        // now calculate the needed coordinates
        A, HSTACK(lowerWhisker, offset),
        B, HSTACK(Q1_, offset),
        C_, HSTACK(Q1_, offset - halfwidth),
        D, HSTACK(Q2_, offset - halfwidth),
        E_, HSTACK(Q2_, offset + halfwidth),
        F, HSTACK(Q1_, offset + halfwidth),
        G, HSTACK(Q3_, offset + halfwidth),
        H, HSTACK(Q3_, offset - halfwidth),
        I, HSTACK(Q3_, offset),
        J, HSTACK(upperWhisker, offset),
        VSTACK(A, B, C_, D, E_, F, C_, H, G, E_, D, H, I, J)
    )
);