Bootstrap
Description
Bootstrap returns bootstrapped statistics as a column vector: each element is the result of applying a user-defined LAMBDA function to a bootstrap resample (optionally smoothed) of the input data. The result of this function is meant to be a valid estimate of the sampling distribution of the statistic being bootstrapped.
Syntax
Bootstrap(sample, fn, [B=1000], [bw=0]) where
sampleis the data that is resampled byBootSample. Can be univariate (row or column vector) or multivariate (matrix, with rows as observations and columns as variables). If the input is multivariate, resampling is by rows.fnis theLAMBDAfunction that returns the statistic being bootstrapped; for exampleLAMBDA(x, AVERAGE(x))is used to bootstrap the mean. This function must return a single, scalar value: the statistic that is being bootstrapped.Bis the number of bootstrap resamples of the original sample (default 1000)bwis the bandwidth of the smoothed bootstrap (defaultbw=0meaning no smoothing). Ifsampleis multivariate (ie, a matrix) then this argument is ignored.
The output is a column vector with B elements, each of which is the result of applying the LAMBDA function to the bootstrap re-samples of the original data.
Example
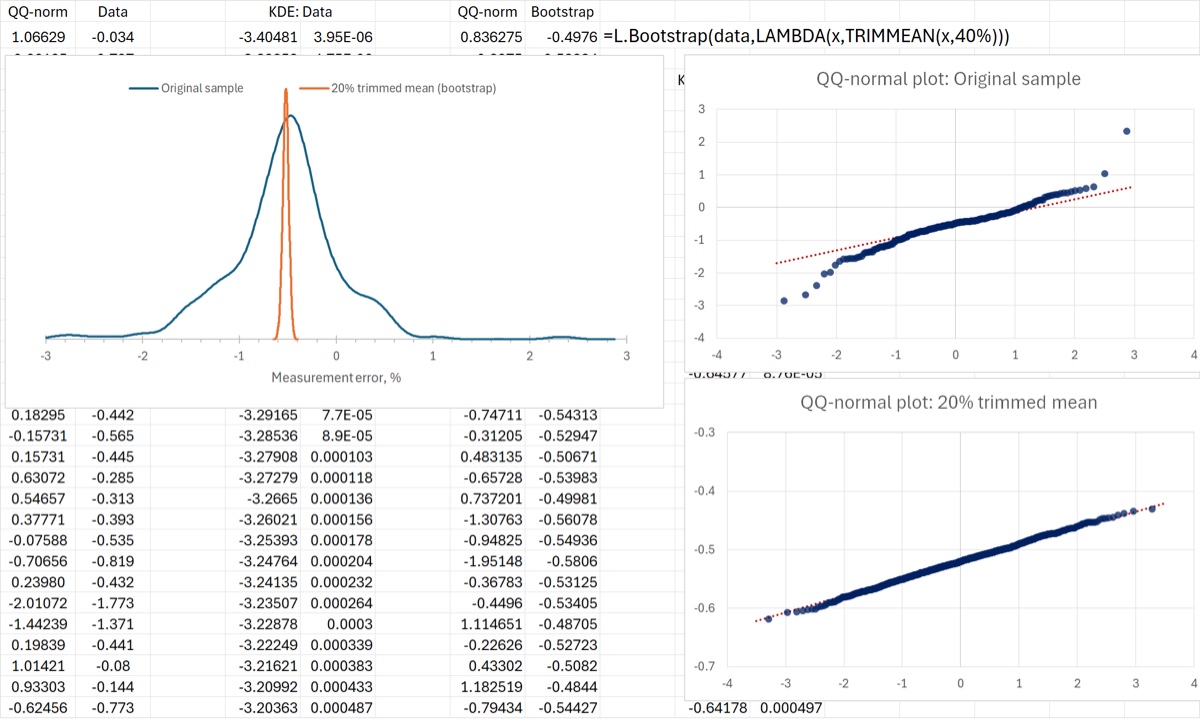
Using Bootstrap allows you to examine (an estimate of) the sampling distribution of a statistic by resampling the original sample. Below is a comparison of the distributions of a real data set and the 20% trimmed mean of that data. One can see the location that is being estimated by the 20% trimmed mean – slightly offset from the mode – and one can see the verification of the Central Limit Theorem by comparing the QQ plots against the standard normal distribution.
The bootstrap in this case is invoked with the call L.Bootstrap(data, LAMBDA(x, TRIMMEAN(x, 40%))) which returns 1000 bootstrapped 20% trimmed means. Note that this is a volatile function so the numbers and plot if you open the Excel file will be slightly different. Also note that data refers to a named range containing the sample, and that invoking TRIMMEAN with 40% returns the 20% trimmed mean.
Download: Bootstrap.xlsx
Source Code
Helpers used: BootObs
The key line in the code below is line 9, which is essentially a (vectorized) FOR loop that applies the callback LAMBDA function to B different bootstrap re-samples of the original data. BootSample is a dependency, and this function inherits its volatility (since it calls Excel’s RANDARRAY function).
Bootstrap = LAMBDA(
    sample,
    fn,        // statistic to apply to each bootstrap sample, e.g. LAMBDA(x,AVERAGE(x))
    [B],       // number of bootstrap samples (default 1000)
    [bw],      // smoothing bandwidth factor, same meaning as KDE's bw (default 0 = unsmoothed)
    LET(
        B, IF(ISOMITTED(B), 1000, B),
        bw, IF(ISOMITTED(bw), 0, bw),
        MAP(SEQUENCE(B), LAMBDA(_, fn(BootSample(sample, bw))))
    )
);